Concept
Re-distribution
Re-distribution is a Market Structure concept. The Library holds 1 implementation, a working definition you can pull into Quant.
Top Re-distribution indicator
The top custom implementation, built on the original standard Re-distribution formula.
1 total
Want to trade Re-distribution? The implementation below is one prompt away from a backtested strategy in Quant.
What is re-distribution?
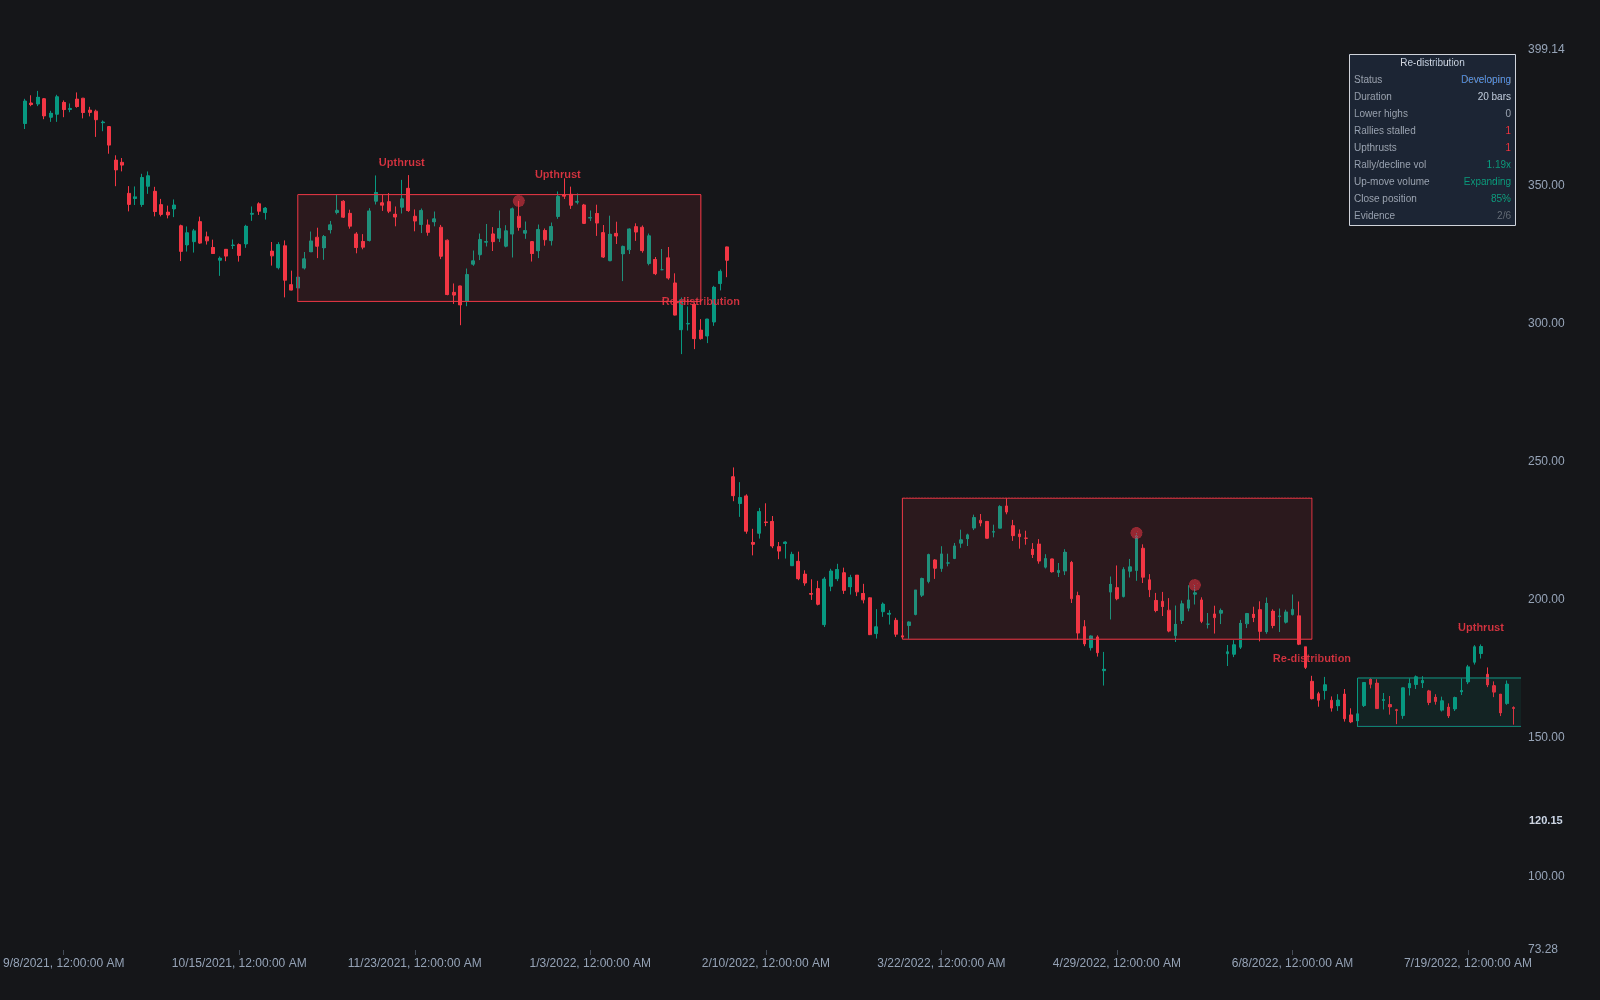
Re-distribution is a pause in an established downtrend during which larger sellers rebuild short positions or unload remaining inventory before the decline resumes. It is the bearish counterpart of re-accumulation: where distribution proper forms after an uptrend and ends it, re-distribution forms mid-downtrend, inside a trading range that interrupts an ongoing markdown. The term comes from the Wyckoff tradition and asserts that the rally or sideways pause is supply being reoffered at better prices, not genuine demand returning.
The concept exists because downtrends, like uptrends, move in legs. Short covering, bargain hunting, and oversold bounces create rallies that look hopeful, and the Wyckoff Method frames the question honestly: is this pause a base forming, or a staging area for the next leg down? Re-distribution is the second answer. Behaviorally, rallies inside such ranges tend to stall at or below prior supply, volume often expands on declines and contracts on rallies, and lower highs form within the range.
Traders care because the cost of misreading the pause is asymmetric in both directions. Buying a supposed bottom that is actually re-distribution means catching a falling market; shorting a supposed re-distribution range that is actually accumulation means fighting the new trend from its worst location. The label is a working hypothesis about who is in control inside the range, and it stays provisional until the range resolves with a decisive break.
How to identify re-distribution on a chart
Context first: the range must sit inside a downtrend that is already underway.
- 1Confirm a prior markdown leg into the range; a range forming after a long advance is candidate distribution, not re-distribution.
- 2Mark the boundaries from the first bounce high and reaction low, then judge behavior at the edges of the range.
- 3Look for weak rallies: advances on contracting volume that stall at lower highs, with closes concentrating in the lower half of the range.
- 4Watch for an upthrust, a brief poke above range resistance that fails quickly, often the bearish mirror of a spring.
- 5Treat the diagnosis as confirmed when price breaks and holds below range support; until then, the bullish alternative of a developing base remains possible.
How traders use it
- As a trend-continuation framework: traders shorting a probable re-distribution range sell strength near range resistance or the breakdown of support, with invalidation above the range high.
- As protection against premature bottom-fishing: recognizing that mid-downtrend ranges frequently resolve lower discourages buying every pause simply because the market has stopped falling.
- As a diagnostic comparison: weighing volume on rallies against declines, and tracking whether swing highs inside the range step down, builds the evidence file before committing capital.
- As a risk anchor: the range high defines where the re-distribution thesis dies, since sustained acceptance above it argues accumulation instead. Misdiagnosis is common, so position size should reflect that the label is a probability, not a fact.
Re-distribution vs adjacent range concepts
Re-accumulation: Re-accumulation is the bullish mirror: a mid-uptrend pause before continuation higher. The two ranges can look nearly identical in price alone, which is why the comparative diagnosis leans on volume and behavior at the edges.
Wyckoff distribution schematic: The distribution schematic describes a top after a full uptrend. Re-distribution reuses the same internal vocabulary but occurs mid-downtrend and often resolves faster, with shallower rallies.
Bear flag: A bear flag is the classical-charting name for a brief upward-drifting pause in a downtrend. A short, tight re-distribution range and a bear flag frequently describe the same price action in different vocabularies.
Concept family
Market Structure
31 concepts mapped · 31 in the Library
Re-distribution FAQ
Turn Re-distribution into a trading strategy.
Take the implementation from this page into Quant, then build on it, backtest it on real data, and keep refining it in conversation.