Concept
Macro Event Days
Macro Event Days are Time, Sessions & Seasonality concepts. The Library holds 1 implementation, a working definition you can pull into Quant.
Top Macro Event Days indicator
The top custom implementation, built on the original standard Macro Event Days formula.
1 total
From studying Macro Event Days to trading it: take the implementation below into Quant and backtest it instantly.
What are Macro Event Days?
Macro event days are sessions dominated by scheduled economic releases: central-bank decisions and press conferences (FOMC, ECB), inflation prints like CPI, US nonfarm payrolls, and similar red-flag calendar items. Around the release, liquidity is pulled, spreads widen, and price often whips both directions within seconds as the number is parsed; afterward, a genuine surprise can reprice the market for hours. Naming these days matters because they are a different regime: statistics gathered on quiet sessions, from typical ranges to day-of-week effects, tend not to transfer to them.
The timing is the tractable part. Release times are published well in advance, so the uncertainty is the number, not the clock; that known-timing, unknown-outcome structure is the scheduled side of event-driven volatility.
Mechanically, the regime shift is about liquidity as much as the number: market makers widen or pull quotes ahead of a red-flag print, leaving the book thinnest just as the most aggressive flow arrives. The disruption is pinned to the clock inside the ordinary structure of trading sessions: major US prints land at 8:30 am ET before the equity open, Fed decisions at 2:00 pm ET with a press conference at 2:30, so the same session template plays out differently depending on the calendar.
For researchers, event days function as labels. A handful of scheduled sessions can dominate a month's realized range, so statistics computed without tagging them, from average daily range to tendencies compiled with seasonality tooling, blend two regimes into one misleading number. The entanglement runs deep: payrolls lands on the first Friday of most months, CPI mid-month, and Fed decisions roughly every six weeks, so event effects mix into weekday and month-of-year patterns unless separated deliberately. Equity traders face an extra wrinkle: an 8:30 release prints during extended hours, so the reaction bar appears or vanishes with the chart's RTH vs ETH setting.
How to identify macro event days on a chart
Tag by calendar first, then confirm the signature on the chart:
- 1Pull the release schedule: red-flag times such as the 8:30 am ET prints and 2:00 pm ET Fed decisions are published months in advance on the economic calendar.
- 2On an intraday chart, look for the signature bar: sudden range expansion at an exact clock time, often wicked both ways, on volume far above neighboring bars.
- 3Check the minutes before: contracting ranges and thinning volume as participants stand down are as characteristic as the spike itself.
- 4Separate the release from the open: an 8:30 print reshapes the tape before the 9:30 equity open and can be mistaken for unusual opening range behavior.
- 5On daily charts, event days appear as outlier ranges; label them from the calendar rather than guessing from bar size, so quiet days that happened to be volatile are not mislabeled.
How traders use it
- Standing aside: many intraday systems disable entries in a buffer before and after red-flag releases because spread, slippage, and stop-through risk spike; a fill during the print is not a normal fill.
- Trading the aftermath: waiting for the initial two-sided whip to resolve, then joining the post-release direction or fading an overextended spike; both are event playbooks with failure modes, not certainties.
- Cleaning research: tagging event days in backtests explains outlier bars and keeps quiet-day statistics such as average range and seasonal tendencies from being contaminated by a different regime.
- Sizing around holds: widening stops, reducing size, or flattening when a position must live through a release; the day's extreme frequently forms near the print, a pattern visible in session high/low statistics once event days are tagged.
- Trading post-event structure: the release bar's high and low become reference levels, with acceptance beyond them traded like a scheduled cousin of opening-range tactics.
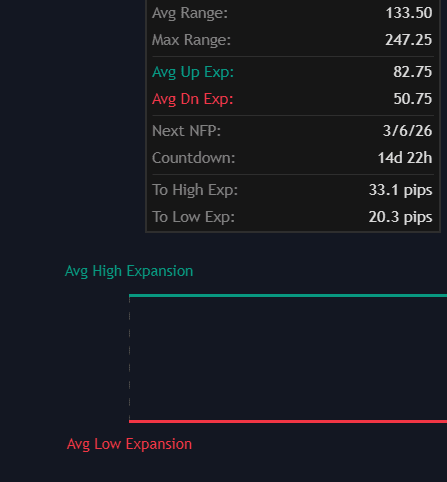
- Plotting the calendar on the chart: economic-calendar overlays and NFP price-zone tools draw upcoming red-flag times directly on price, keeping the buffer logic visible.
Macro Event Days vs related calendar effects
Day-of-week Effects: A statistical tendency tied to the weekday itself; event days are tied to a specific calendar entry. The two entangle, payrolls landing on Fridays, so research that ignores one contaminates its estimate of the other.
Intraday Time-of-day Effects: Recurring clock-time behavior averaged across all days. A release is a one-off spike pinned to a time; folding it into time-of-day averages without tagging inflates the apparent everyday effect at that hour.
Session Open/close Behaviors: Opens and closes are scheduled liquidity events that recur every day; macro releases are scheduled information events that occur irregularly. Both concentrate volume at known times, but the release adds an unknown number to the known clock.
Concept family
Time, Sessions & Seasonality
32 concepts mapped · 32 in the Library
Macro Event Days FAQ
Turn Macro Event Days into a trading strategy.
Take the implementation from this page into Quant, then build on it, backtest it on real data, and keep refining it in conversation.