Concept
January Effect
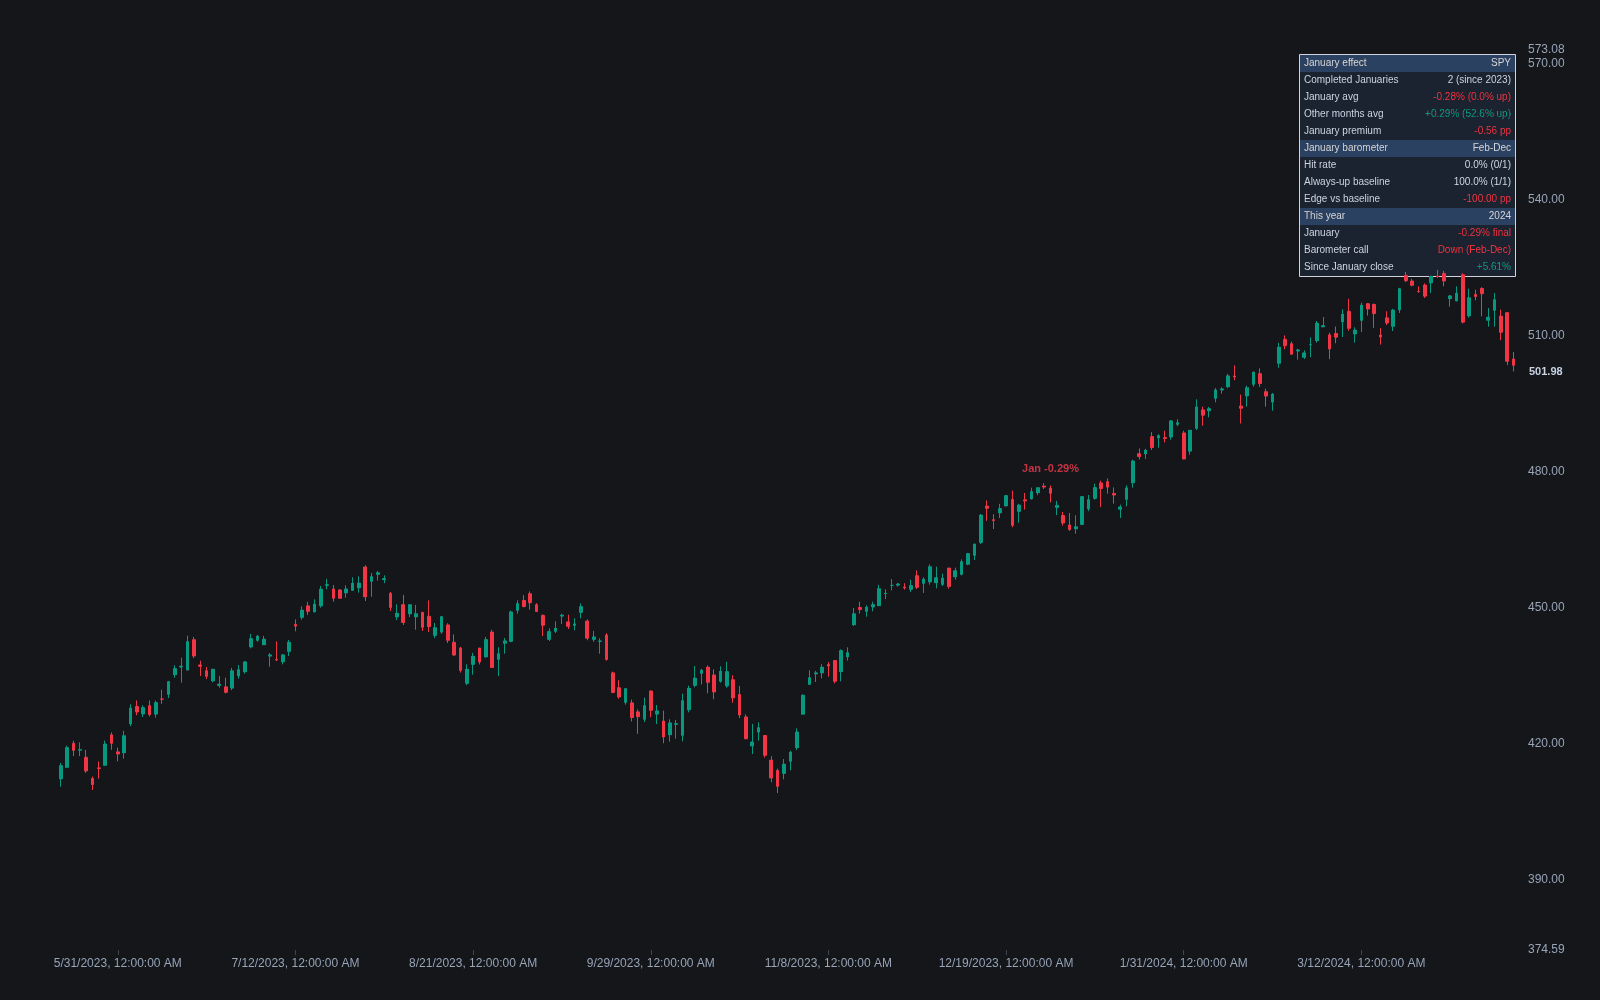
January Effect, also known as January barometer, is a Time, Sessions & Seasonality concept. The Library holds 1 implementation, a working definition you can pull into Quant.
Top January Effect indicator
The top custom implementation, built on the original standard January Effect formula.
1 total
The January Effect implementation below can become a backtested trading strategy — describe your rules and Quant writes the code.
What is the January Effect?
The January effect is the historical tendency of stocks, especially small-caps, to post unusually strong returns in January, documented in US academic studies of the 1970s and 1980s. The most cited explanation is tax-loss selling: losing positions sold in December for tax reasons are repurchased in the new year, and the rebound concentrates in the small, beaten-down names where December selling pressure was heaviest. Window dressing by institutions and fresh new-year cash allocations are offered as supporting mechanisms.
A related but distinct idea often filed under the same name is the January barometer, popularized by Yale Hirsch in the Stock Trader's Almanac: the claim that January's direction sets the tone for the full year. The barometer is a signal about the remaining eleven months, whereas the January effect proper is a return anomaly inside January itself. The two are frequently conflated, and both deserve skepticism on their own terms.
The honest status report: the classic small-cap January premium has weakened substantially since it was publicized, which is what theory predicts for a calendar anomaly that is easy to front-run. Modern samples show inconsistent results, and after transaction costs in small illiquid names the historical edge shrinks further. The barometer, for its part, is heavily influenced by the market's general upward drift: years simply tend to be positive, so a positive January "predicting" a positive year carries less information than the hit rate suggests.
How traders use it
- As a seasonal backdrop rather than a trigger: some traders give marginally more benefit of the doubt to small-cap strength in early January, especially in names that were heavily sold in December, without treating the calendar alone as an entry.
- In pairs and relative-value framing: the historical pattern was strongest in small versus large stocks, so tests are usually run on the size spread rather than on the index outright.
- As a scheduling input for tax-loss rebound strategies: candidates are screened in December, and January is the window where any rebound has historically concentrated.
- As a caution case study: the January effect is the textbook example of an anomaly decaying after publication, and it is worth testing any seasonal edge on post-publication data only, with tools like month-of-year seasonality studies and proper out-of-sample discipline.
- The barometer, if used at all, is treated as weak context. Its accuracy advantage over always predicting an up year is modest, and it offers no risk management content.
January Effect vs Related Seasonal Patterns
Santa Claus rally: The Santa Claus rally covers the last five trading days of December plus the first two of January, a much shorter window, and is framed as a broad-market tendency rather than a small-cap phenomenon.
Tax-loss selling season: Tax-loss selling is the proposed cause; the January effect is the proposed consequence. Studying the December selling pressure directly is often more actionable than trading the January label.
Turn-of-month effects: Turn-of-month strength appears around every month boundary and is attributed to recurring cash flows, whereas the January effect is specific to the calendar year turn and tax mechanics.
Concept family
Time, Sessions & Seasonality
32 concepts mapped · 32 in the Library
January Effect FAQ
Turn January Effect into a trading strategy.
Take the implementation from this page into Quant, then build on it, backtest it on real data, and keep refining it in conversation.