Concept
Futures Roll Dates
Futures Roll Dates are Time, Sessions & Seasonality concepts. The Library holds 1 implementation, a working definition you can pull into Quant.
Top Futures Roll Dates indicator
The top custom implementation, built on the original standard Futures Roll Dates formula.
1 total
Want to trade Futures Roll Dates? The implementation below is one prompt away from a backtested strategy in Quant.
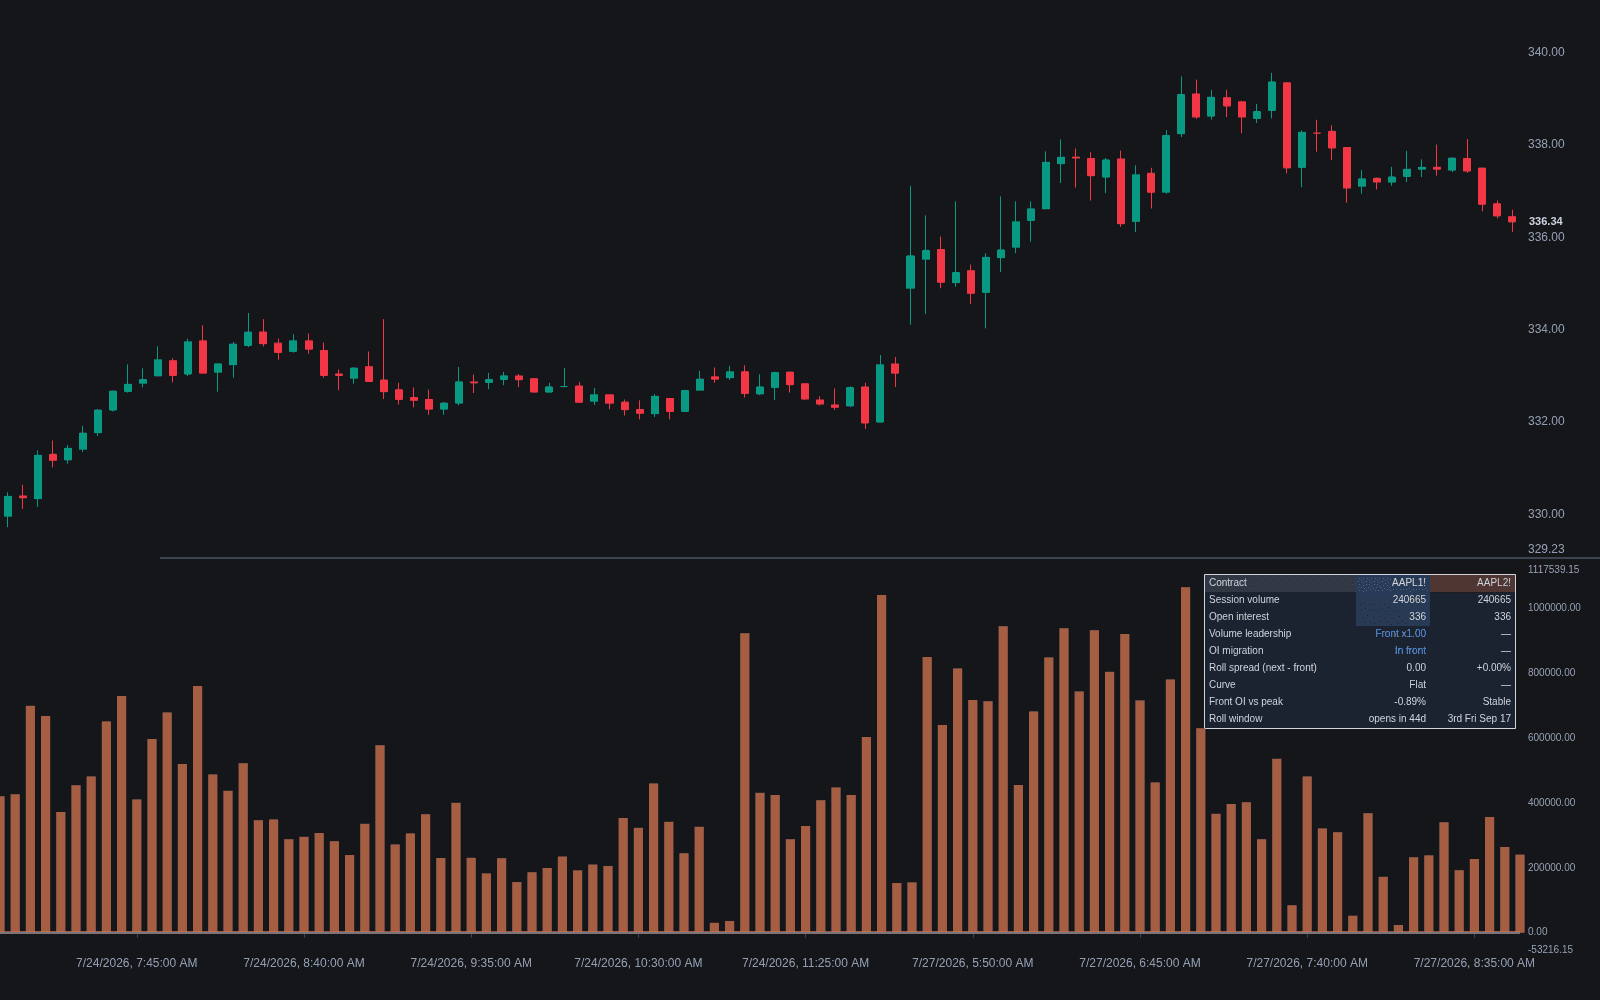
What are Futures Roll Dates?
Futures roll dates are the periods when trading activity migrates from an expiring futures contract to the next one out on the curve. Holders who want continuous exposure close the front contract and open the next, so volume and open interest cross over from old to new in a recognizable window. Equity index futures roll quarterly, with the bulk of activity in the week or so before the third-Friday expiration; most physical commodity and energy contracts roll monthly, with timing shaped by first-notice and last-trading days that position holders must respect.
Rolls matter for three distinct reasons. First, liquidity: during the roll window two contracts share the flow, and after it the old front month thins quickly, so anyone trading the wrong contract faces wider spreads. Second, data: continuous chart series must splice contracts together, and because consecutive contracts trade at different prices, unadjusted splices create artificial gaps while back-adjusted series shift historical price levels. Third, economics: the price difference paid or received when rolling reflects the curve, so persistent contango or backwardation turns rolling into a recurring cost or yield that separates a futures holder's return from the spot price path.
The roll is also an information event. Roll-period spread pricing in index futures reflects funding and dividend expectations, related to the fair value basis, and unusual roll behavior in commodities can signal storage stress or delivery-market tightness. Position data such as COT reports also gets noisier around rolls as positions are rewritten into the new month.
How to Spot the Roll on Your Charts
The migration is visible in volume and open interest if you plot both contracts:
- 1Pull up the front contract and the next contract side by side in the roll window (for US equity index futures, roughly the week before the third Friday of March, June, September, and December).
- 2Watch daily volume: the day the next contract out-trades the expiring one is the conventional marker that the roll has effectively happened.
- 3Confirm with open interest, which falls in the expiring contract and builds in the new one as positions migrate rather than merely day-trade.
- 4For physical commodities, check first-notice and last-trading dates; open interest in the front month typically collapses ahead of first notice as non-delivering holders exit.
- 5On continuous charts, verify how your data vendor rolls and adjusts; a 'gap' printed on a roll date may be a splice artifact rather than a market move.
How traders use it
- Active traders switch their working contract as soon as volume leadership passes to the new month, because execution quality in the abandoned front month deteriorates within days.
- Backtesters treat roll handling as a first-order decision: unadjusted continuous series inject phantom gaps into signals, while back-adjusted series distort long-history percentage returns, so the adjustment method must match the strategy's logic.
- Position traders in commodities budget for roll cost explicitly, since rolling long positions in a contango market bleeds return month after month regardless of the spot trend, a central input to curve position analysis.
- Spread traders trade the roll itself, taking calendar-spread positions in the roll window when index roll pricing or commodity storage economics look mispriced.
- Chart readers annotate roll dates so that gaps, volume surges, and open-interest swings in the roll window are not misread as breakout conviction or capitulation.
Futures Roll Dates vs Related Concepts
Expiration Effects: Expiration is the terminal event; the roll is the migration beforehand. Roll flow is about maintaining exposure via calendar spreads, while expiration effects concern hedge unwinds and settlement mechanics on the date itself.
Futures Basis: Basis is the futures-minus-spot price gap at any moment. Roll dates are when holders actually pay or receive the spread between contracts, converting the curve's shape into realized cost or yield.
Curve Position: Curve analysis studies the whole term structure of contract prices. Roll dates are the recurring calendar events where positions step along that curve, and where its slope becomes a cash flow.
Concept family
Time, Sessions & Seasonality
32 concepts mapped · 32 in the Library
Futures Roll Dates FAQ
Turn Futures Roll Dates into a trading strategy.
Take the implementation from this page into Quant, then build on it, backtest it on real data, and keep refining it in conversation.