Concept
Session High/low Statistics
Session High/low Statistics are Time, Sessions & Seasonality concepts. The Library holds 3 implementations, each one a working definition you can pull into Quant.
Top Session High/low Statistics indicators
The top custom implementations, built on the original standard Session High/low Statistics formula.
3 total
Any of the 3 Session High/low Statistics implementations below can become a backtested trading strategy — describe your rules and Quant writes the code.
.png&w=3840&q=75)
What are Session High/low Statistics?
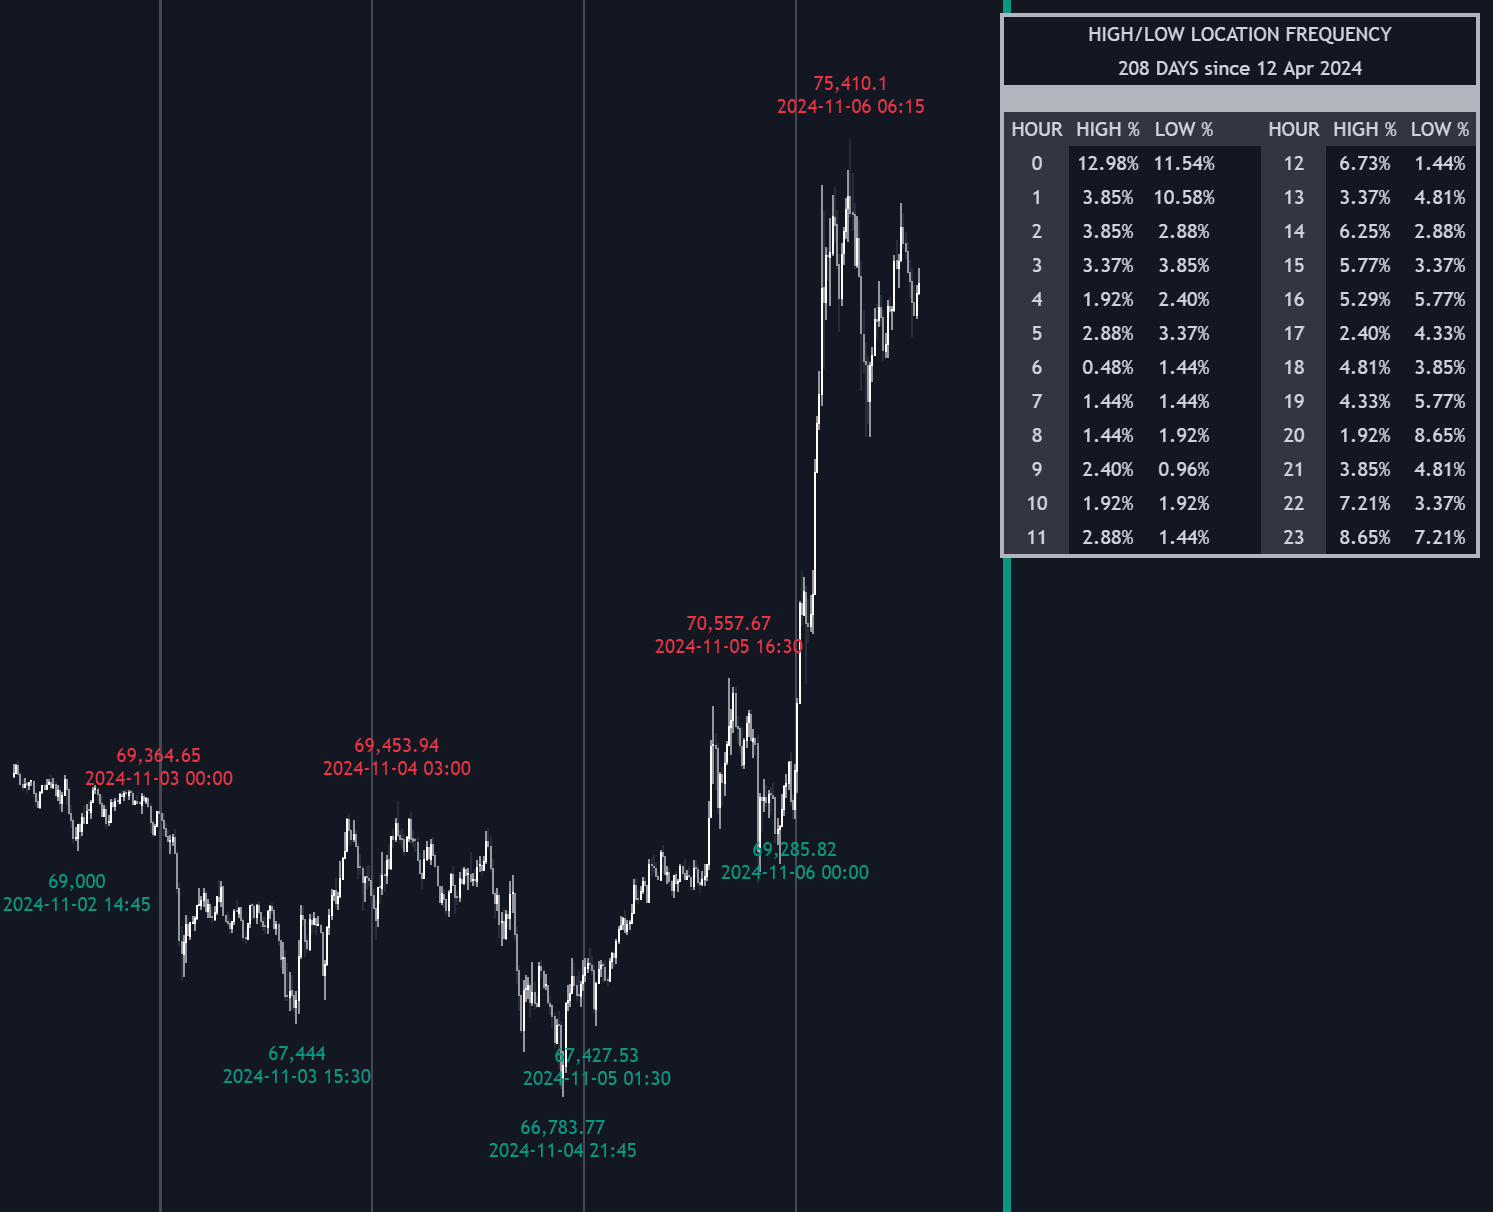
Session high/low statistics measure when a session's extreme prices tend to form. Instead of treating the high and low of the day as if they could land anywhere, the method bins each historical session by clock time, records which bin printed the high and which printed the low, and aggregates the sample into a frequency distribution. The output is a probability map of the trading day: how often the daily high forms in the opening hour, how often the low prints during a given one of the trading sessions, how often an extreme set early survives untouched to the close.
On most markets the distribution is far from uniform. Highs and lows cluster near the open and, less strongly, into the close, while quiet midday bins print extremes least often; in 24-hour markets, certain sessions habitually host the day's extreme. These base rates matter because they reframe ordinary decisions: whether a morning sweep is a plausible low of day, whether chasing a fresh high at lunch is fighting the odds, whether a late extreme is likely to keep extending. They are tendencies, not certainties, and trend days and news days routinely break them.
How to calculate session high/low statistics
The measurement is simple enough to run in a spreadsheet, but the details (timezone, session definition, sample checks) decide whether the output is signal or noise.
- 1Define the session and the bins. Choose explicit boundaries (the regular session or a named window; see RTH vs ETH) and divide them into fixed clock-time buckets, for example 30 or 60 minutes, in one stated timezone with daylight-saving transitions handled deliberately.
- 2Tag each historical session. For every session in the sample, record which bucket printed the session high and which printed the low; each session contributes exactly one high observation and one low observation.
- 3Aggregate into frequencies. Compute the percentage of sessions whose high fell in each bucket, and the same separately for lows. Conditioning on context (day of week, up-day versus down-day, open above or below the prior close) often sharpens the picture, at the cost of a smaller sample per condition.
- 4Test stability before trusting it. Split the sample in half and compare the two distributions; a cluster that appears in only one half is more likely noise than edge, and regime shifts can retire old tendencies.
How it's calculated
A frequency profile of the time of day at which each trading session printed its high and its low, built from the last N sessions.
The session definition and timezone drive the result; the same bars binned from a different session start produce different peaks.
When an extreme is touched more than once, convention assigns it to the first touch.
Even a driftless random walk puts its extremes near the open and close more often than mid-session (arcsine law), so judge peaks against that baseline.
How traders use it
- To time reversal attempts: on a market whose lows cluster in the morning, a liquidity sweep of the overnight low at 10 am is a statistically stronger low-of-day candidate than the same sweep at 1 pm.
- To judge whether the extreme is in: as the session ages past the windows where extremes usually form, the odds that the current high or low survives improve, which supports holding winners toward the close instead of exiting on every wobble.
- To ground opening-range models: high/low location frequencies quantify how often the day's extreme forms inside the first 30 to 60 minutes, the statistical footing beneath opening-range and defining range frameworks.
- To map sweep targets: sessions that habitually set the extreme are also where stops accumulate, so the same statistics double as a guide to session liquidity likely to be run later in the day.
Session High/low Statistics vs related concepts
Intraday Time-of-day Effects: Time-of-day effects describe how volume and volatility move across the session clock in general. Session high/low statistics ask one narrower question: in which window the session's extreme prices tend to print.
Prior Period Levels: Prior period levels put yesterday's or last week's actual high and low on today's chart as reference prices. High/low statistics describe timing distributions across many sessions, not specific price levels.
Opening Range & ORB: The opening range is a single early window traded with breakout rules. Session high/low statistics are the measurements that say how often the day's extreme actually forms inside such a window, and how often it later breaks.
Concept family
Time, Sessions & Seasonality
32 concepts mapped · 32 in the Library
Session High/low Statistics FAQ
Turn Session High/low Statistics into a trading strategy.
Take any implementation from this page into Quant, then build on it, backtest it on real data, and keep refining it in conversation.