Put/call Ratio
Put/call Ratio is a Breadth, Sentiment & External Data concept. The Library holds 1 implementation, a working definition you can pull into Quant.
equity/index/total
Top Put/call Ratio indicator
The top custom implementation, built on the original standard Put/call Ratio formula.
1 total
Want to trade Put/call Ratio? The implementation below is one prompt away from a backtested strategy in Quant.
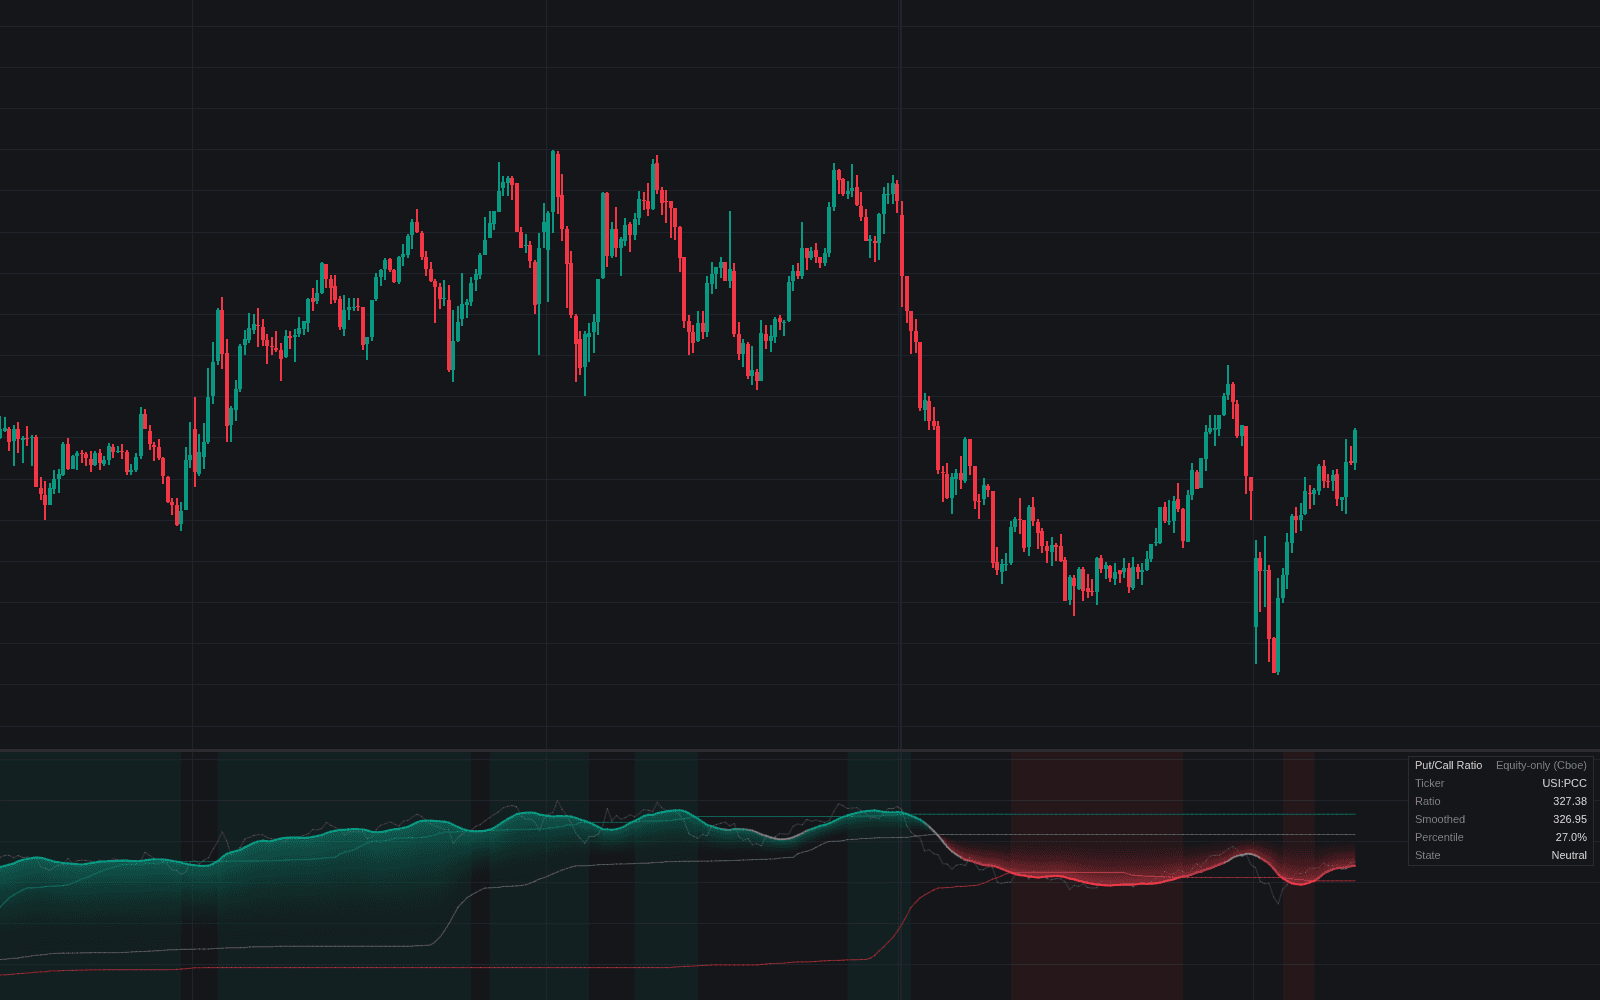
What is the Put/call Ratio?
The put/call ratio divides the volume of put options traded by the volume of call options traded over a session, either for a single underlying or aggregated across a whole market. Readings above 1 mean more puts changed hands than calls. It is a sentiment gauge with a contrarian reading: heavy put activity is taken as fear or hedging demand, heavy call activity as speculative appetite, and extremes in either direction are watched as signs the crowd's positioning may already be spent.
As a sentiment tool the ratio is usually credited to Martin Zweig, who introduced it in Barron's in the early 1970s. The premise belongs to the contrary-opinion tradition: when nearly everyone has positioned for a fall, much of the selling that would cause it is already done. Cboe institutionalized the measurement and publishes the daily equity-only, index-only, and total ratios most analysts chart.
The aggregate versions differ meaningfully. The equity-only ratio (single-stock options) is the preferred sentiment read because it is dominated by directional speculation and usually sits below 1. The index ratio runs persistently higher because institutions buy index puts as portfolio insurance, so its level reflects hedging more than opinion. The total ratio mixes both. Raw daily values are noisy and thresholds drift as market structure evolves, so practitioners smooth the series and compare it with its own recent distribution rather than fixed levels.
Modern options flow blurs the old mapping of puts to fear. Puts are sold to harvest premium, bought as legs of spreads, and traded in huge volume as same-day expiries, none of which expresses simple directional opinion; heavy flow also feeds dealer hedging, the territory of gamma exposure analysis. The ratio remains a fast, free summary of options activity, but one sentiment input among several, not a verdict.
How to read the put/call ratio on a chart
The ratio is a data series rather than a pattern, so reading it well is mostly preparation.
- 1Choose the series deliberately: equity-only for crowd sentiment, index for institutional hedging tone, total for the blend; for single names, their own options volume.
- 2Smooth it: raw daily prints are jagged, and a short moving average, the 10-day a long-standing choice, turns noise into a readable swing.
- 3Define extremes relative to its own history, marking the smoothed series' upper and lower bands over a rolling window rather than decade-old fixed thresholds.
- 4Plot it beneath the index it describes and study how earlier extremes resolved before trusting the current one.
- 5Cross-check with options prices: fear showing up in both option volumes and implied volatility is more convincing than either alone.
How it's calculated
The ratio of traded put volume to traded call volume, read as a gauge of defensive versus bullish option positioning.
An open-interest variant divides put open interest by call open interest instead of volume.
Readings above 1 mean puts out-traded calls; the CBOE publishes total, equity-only, and index-only series with different typical baselines.
The daily series is noisy, so it is often smoothed with a 5- or 10-day moving average.
How traders use it
- As a contrarian extreme detector: smoothed equity-only readings in the upper tail of their rolling range, defined by percentile rank or a similar normalization, flag broad fear that has sometimes coincided with tradable lows, while unusually low readings flag complacency. Extremes can extend, so most frameworks wait for price confirmation.
- As confirmation alongside other options-derived gauges: a put/call extreme carries more weight when implied volatility and the VIX are telling the same story about fear or complacency.
- With open interest instead of volume: OI-based ratios update slowly and read as accumulated positioning rather than daily flow, which some traders use as context around expirations.
- On individual names: a single stock's put/call ratio around earnings shows how speculation is tilted into the print, judged against that symbol's own baseline; normal levels differ enormously between a utility and a story stock.
- In a sentiment dashboard: options-flow fear reads best next to participation measures such as advance/decline internals or the percentage of stocks above key moving averages; a put/call extreme while breadth improves is the combination contrarians hunt at lows.
Put/call Ratio vs related concepts
VIX: Both are options-derived fear gauges, but the VIX is computed from option prices (implied volatility) while the put/call ratio counts volumes. One tracks the price of insurance, the other the quantity traded; they usually rhyme, and divergences are worth attention.
Open Interest: Volume-based put/call ratios measure the day's flow; open interest measures contracts still outstanding. A high ratio today can coexist with put-light positioning overall. Flow answers what traders did today, open interest what remains on the books.
Gamma Exposure: The put/call ratio treats options as opinions; gamma exposure treats them as mechanics, estimating how dealer hedging amplifies or dampens index moves. One infers sentiment from volume, the other models a structural force.
Concept family
Breadth, Sentiment & External Data
56 concepts mapped · 56 in the Library
Put/call Ratio FAQ
Turn Put/call Ratio into a trading strategy.
Take the implementation from this page into Quant, then build on it, backtest it on real data, and keep refining it in conversation.