Concept
EquiVolume
EquiVolume, also known as CandleVolume, Arms, is a Meta & Composition concept. The Library holds 1 implementation, a working definition you can pull into Quant.
Top EquiVolume indicator
The top custom implementation, built on the original standard EquiVolume formula.
1 total
Want to trade EquiVolume? The implementation below is one prompt away from a backtested strategy in Quant.
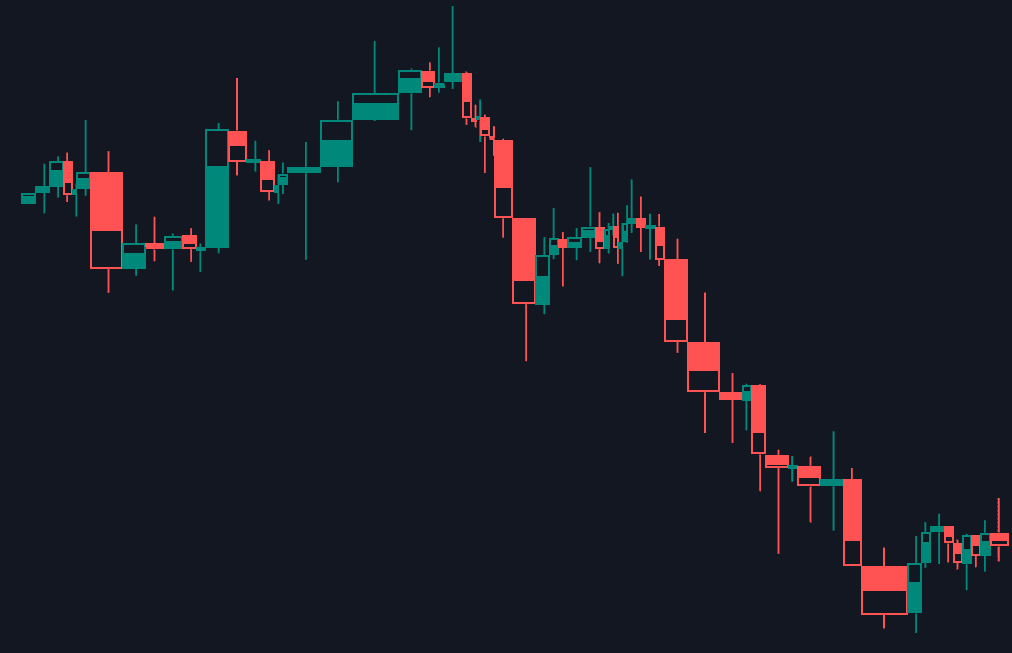
What is EquiVolume?
EquiVolume is a charting style introduced by Richard W. Arms Jr. in his 1971 book Profits in Volume. Arms, also known for the Arms Index (TRIN), wanted volume moved out of a separate pane and into the price plot itself: each period is drawn as a box whose height spans the high-to-low range and whose width is proportional to the period's volume, so heavy-participation bars print wide and quiet bars print narrow. The CandleVolume variant keeps candlestick open-close bodies while borrowing the volume-scaled width.
Reading the chart is an exercise in effort versus result. A tall, wide box (Arms called it a power box) is range with participation, the signature of a move with real backing. A tall, narrow box is movement on thin trade, easier to unwind. A short, wide box is heavy volume that went nowhere, which near the edge of a move often reads as absorption and precedes some turns, though not reliably enough to trade on its own. Widths are relative to recent bars, so the same volume prints differently in different eras of the chart.
EquiVolume belongs with the alternative bar types that re-encode the chart rather than adding an indicator. Renko discards time and volume to isolate price movement; Heikin Ashi recomputes bar values to smooth the read; EquiVolume keeps every period and its prices intact but lets participation set the geometry. The cost is a distorted x-axis: horizontal distance measures traded activity, not elapsed time, so a busy session occupies more width than a quiet week, time-anchored tools plot unevenly, and the horizontal axis no longer behaves like conventional chart scales.
EquiVolume survives as a specialist lens. Few platforms ship it natively, so it is usually reproduced with custom scripts, such as LuxAlgo's EquiVolume on TradingView, which draw volume-scaled boxes on the chart. Users consult it for specific questions, whether a breakout had participation, whether a rally is thinning, whether heavy trade at an extreme went nowhere, and keep a conventional chart alongside for session context, a version of top-down analysis across chart representations rather than timeframes.
How to Read an EquiVolume Chart
Identification is about decoding the boxes once the chart type is applied:
- 1Apply the EquiVolume chart type or script; price bars become rectangles and the separate volume pane disappears.
- 2Read height as the period's high-to-low range and width as its volume relative to recent bars.
- 3Scan for tall, wide power boxes: the bars where range and participation arrived together.
- 4Note short, wide boxes at swing extremes: heavy trade without progress, a candidate for exhaustion.
- 5Watch box widths shrink as a consolidation matures, then judge the resolution bar's width against them.
- 6Remember the x-axis is activity, not time: check timestamps before assuming equal spacing means equal duration.
How traders use it
- To qualify breakouts: a breakout printing wide boxes shows participation behind the move, while narrow boxes flag a thin push that convention reads as more failure-prone, the box-width version of checking volume at the breakout.
- To spot climactic turns: short, wide boxes after an extended run mark heavy two-sided trade with little progress, a classic exhaustion candidate that still needs price confirmation before acting.
- To watch consolidations mature: boxes that narrow as a range develops show volume drying up, useful context for judging whether a resolution attempt has fuel behind it.
- To grade trend health: impulse bars printing wide while pullbacks print narrow show participation aligned with direction; widening pullback boxes are an early warning worth cross-checking with a trend/range classifier.
- To anchor discretionary volume reads: box geometry makes effort versus result visible at a glance, harder to ignore than a histogram at the bottom of the chart and easier to audit in hindsight.
EquiVolume vs related concepts
Renko: Renko rebuilds the chart from fixed-size price bricks, discarding both time and volume to isolate directional movement. EquiVolume keeps every period and its true range, spending its distortion budget on encoding volume instead of filtering price.
Heikin Ashi: Heikin Ashi recalculates bar values from averages to smooth trends, changing the prices displayed while keeping uniform widths. EquiVolume shows true prices and encodes volume in width; one edits the data, the other the geometry.
Alternative Bar Types: The umbrella for every re-encoded chart, from range and tick bars to point-and-figure. EquiVolume is the member that promotes volume into the drawing itself rather than resampling time or price.
Concept family
Meta & Composition
28 concepts mapped · 28 in the Library
EquiVolume FAQ
Turn EquiVolume into a trading strategy.
Take the implementation from this page into Quant, then build on it, backtest it on real data, and keep refining it in conversation.