Concept
Kagi
Kagi is a Meta & Composition concept. The Library holds 1 implementation, a working definition you can pull into Quant.
Top Kagi indicator
The top custom implementation, built on the original standard Kagi formula.
1 total
The Kagi implementation below can become a backtested trading strategy — describe your rules and Quant writes the code.
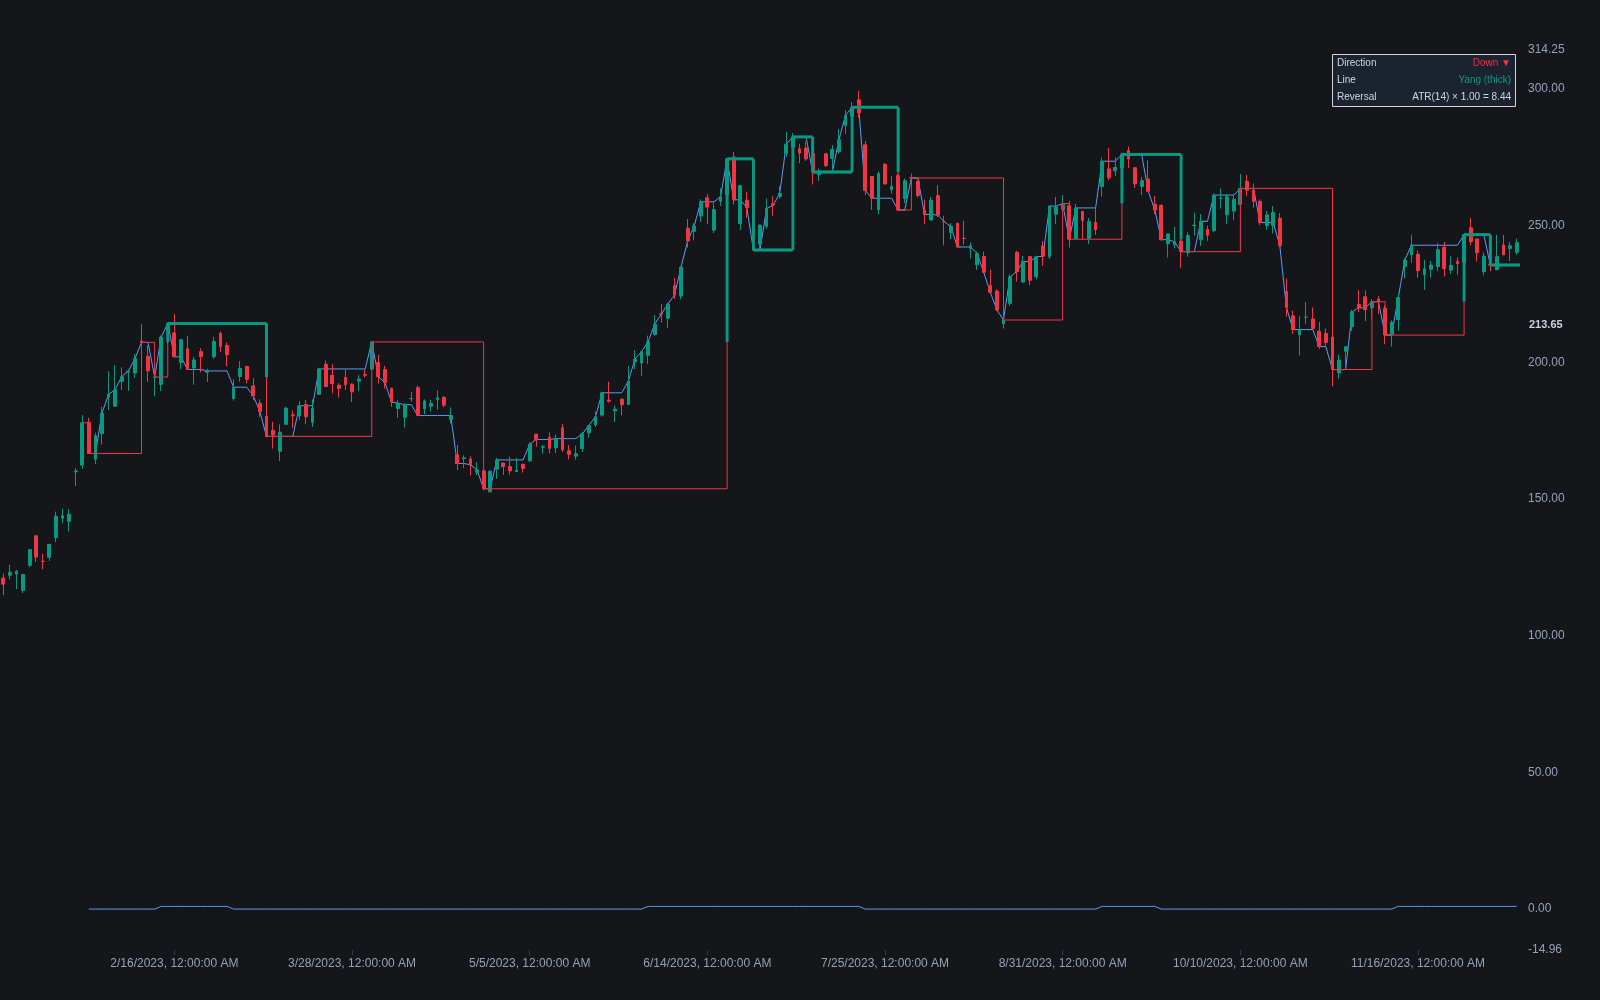
What is a Kagi Chart?
A Kagi chart is a Japanese price-only chart that ignores time entirely: the line extends vertically while price moves in the current direction and turns only when price reverses by a predefined amount. The result is a series of connected vertical lines and short horizontal shoulders whose spacing reflects how price moved, not when. Sessions with no meaningful movement add nothing to the chart, while a volatile day can add several turns.
Kagi's distinctive feature is line thickness. The line is drawn thick (traditionally called yang) after price exceeds the prior swing high and thin (yin) after it breaks the prior swing low. Thickness changes therefore mark the moments when the market takes out a previous extreme, embedding a simple structure-break signal directly into the chart's appearance rather than requiring separate analysis of swing highs and lows.
Traders use Kagi for the same reason they use other time-independent transforms: filtering. By requiring a minimum reversal (a fixed amount, a percentage, or an ATR multiple in modern implementations) before the line turns, Kagi suppresses noise that candlestick charts render faithfully, making trends and their genuine interruptions easier to see. The cost is the usual one for such transforms: intrabar detail, gaps, and time-based context such as session behavior are discarded, and the chart's character depends heavily on the chosen reversal size.
How to read a Kagi chart
Kagi charts are read from line direction, thickness changes, and the pattern of shoulders and waists.
- 1Note the reversal setting first: a fixed amount, percentage, or ATR multiple. Every structure on the chart is conditional on this choice, and different settings can tell different stories.
- 2Follow the vertical lines for direction: the line rises while price advances and only turns after a full reversal-sized move against it, drawn as a short horizontal connector to a new vertical line.
- 3Watch thickness changes: the line turns thick when price exceeds the previous Kagi high (a shoulder) and thin when it breaks the previous Kagi low (a waist). These are the chart's built-in breakout markers.
- 4Track the sequence of shoulders and waists: rising waists and rising shoulders describe an uptrend in Kagi terms; a series of falling shoulders warns the advance is failing.
- 5The classic signal set is thickness-based: thin turning thick is the traditional buy indication, thick turning thin the traditional sell indication, typically confirmed against higher-timeframe context rather than traded blind.
How traders use it
- As a trend filter: many traders take directional bias from the Kagi line's thickness and direction, then execute entries on a conventional chart, keeping the noise-filtering benefit without giving up execution detail.
- As a structure-break detector: because thickness flips exactly when a prior extreme is taken out, Kagi automates a piece of swing analysis that is otherwise done by eye or with a zigzag overlay.
- For support and resistance clarity: repeated shoulders or waists near the same level stand out sharply on a Kagi chart, since all sideways noise between tests has been compressed away.
- With volatility-adaptive settings: ATR-based reversal amounts keep the chart's sensitivity roughly constant across regimes, whereas fixed amounts make the chart hyperactive in volatile periods and inert in quiet ones.
- Honest limitation: signals arrive only after a full reversal-sized move has already happened, so Kagi entries and exits are structurally late, and no backfilled time axis exists for aligning it with time-based indicators.
Kagi vs related chart transforms
Renko: Renko builds uniform bricks of fixed size, so every advance is quantized into equal steps. Kagi draws continuous lines of arbitrary length and adds the thickness signal tied to prior extremes, which Renko lacks.
Point & Figure: Point and figure also uses a reversal filter but stacks Xs and Os in columns with a box size, supporting its own counting methods. Kagi has no box quantization and encodes breakouts through line thickness instead of column patterns.
Line Break: Line break charts reverse based on closes exceeding the extreme of the prior n lines, so the filter is self-scaling from recent lines. Kagi uses an explicit user-chosen reversal amount, making its sensitivity a direct parameter.
Concept family
Meta & Composition
28 concepts mapped · 28 in the Library
Kagi FAQ
Turn Kagi into a trading strategy.
Take the implementation from this page into Quant, then build on it, backtest it on real data, and keep refining it in conversation.