Concept
Cross-instrument Composition
Cross-instrument Composition, also known as pair spreads, beta-hedged overlays, basket signals, constituent aggregation, is a Meta & Composition concept. The Library holds 3 implementations, each one a working definition you can pull into Quant.
Top Cross-instrument Composition indicators
The top custom implementations, built on the original standard Cross-instrument Composition formula.
3 total
Every Cross-instrument Composition implementation here is strategy-ready: open one in Quant, set your rules, and it backtests automatically.
What is Cross-instrument Composition?
Cross-instrument composition is the umbrella for techniques whose input is built from more than one instrument. Instead of analyzing a single symbol's own prices, the analyst constructs a derived series: a pair ratio or spread between two symbols (ratio charts are the simplest case), a beta-hedged overlay that offsets one leg against another, an equal- or cap-weighted custom basket or index, the same asset aggregated across venues, or a signal computed on one market and applied to a different one. That derived series is then charted and analyzed like any instrument.
The lineage is old. Charles Dow's industrial and railroad averages of the 1880s and 1890s were composites, built on the premise that many stocks read together say more than any one alone. Relative-strength ratio work has been standard in equity analysis since at least the mid-20th century, hedged spreads formalized alongside beta and the capital asset pricing model in the 1960s, and the statistical pairs desks of the 1980s industrialized spread construction.
Composition exists to isolate the exposure that actually interests you. A ratio cancels the direction both legs share and leaves relative performance; a beta-weighted spread aims to cancel market sensitivity and keep the residual; a basket averages away single-name noise to expose a theme. The caveats are statistical and practical: the relationships that justify a composite, measured by correlation or cointegration, drift over time, and the derived series inherits every leg's data problems, from mismatched sessions and illiquid prints to splits and venue differences. A composite is only as clean as its dirtiest input.
Composition of instruments is also worth distinguishing from composition of signals. Composite oscillators and confluence scoring merge indicators computed on one instrument; cross-instrument composition merges the instruments themselves and only then applies indicators. It likewise differs from intermarket analysis, which reads cross-market relationships while each chart stays single-instrument, and from a pairs-trading workflow, a strategy built on top of a composed spread rather than the construction itself. The order matters for interpretation: a derived series has no order book behind it, so ideas that lean on traded prices, volume at a level, or literal support and resistance need translating with care, while purely statistical tools apply directly.
How to build a cross-instrument composite
Most charting platforms accept symbol arithmetic directly in the symbol box, which makes construction a chart-side task.
- 1Choose the legs and the question: relative performance suggests a ratio, hedged exposure a scaled spread, a theme an average of several symbols.
- 2Check alignment before doing math: same sessions, comparable bar timestamps, adequate liquidity in every leg.
- 3Write the expression: A/B for a ratio, A minus k times B for a spread with hedge coefficient k estimated from beta or relative volatility, or a weighted sum for a basket.
- 4Set the scale deliberately: long-history ratios usually belong on a logarithmic chart scale so early and recent history are comparable.
- 5Analyze the result like any series, applying trend tools, mean-reversion bands, or trend/range classifiers to the composite.
How it's calculated
A synthetic series built from two or more instruments, such as a ratio, a hedged spread, or a weighted basket, which is then charted or fed to standard indicators.
Spreads are often built on log prices, Spread_t = ln(P_A,t) - h × ln(P_B,t), which makes h scale-free; h can also be fixed by contract size or FX conversion instead of regression.
Breadth composites aggregate conditions rather than prices, e.g. the percent of the k constituents trading above their own moving average.
Align sessions, time zones, currencies and contract multipliers before composing; any single-instrument indicator can then run on the composed series.
How traders use it
- For relative-strength selection: ratios of candidates against a benchmark or against each other rank leaders and laggards, and the trade is then executed in the individual legs; comparative relative strength formalizes the ranking.
- For spread mean reversion: the spread between historically related instruments is standardized with a z-score and faded at extremes, on the premise, never the promise, that the relationship reasserts itself.
- For breadth and consensus: aggregating constituents, whether counting how many basket components sit above a moving average or summing their volume, turns many charts into one regime input.
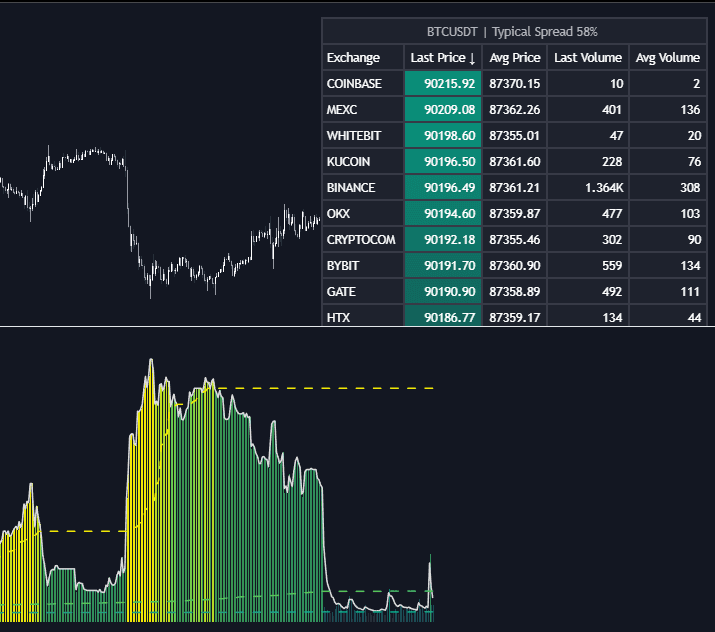
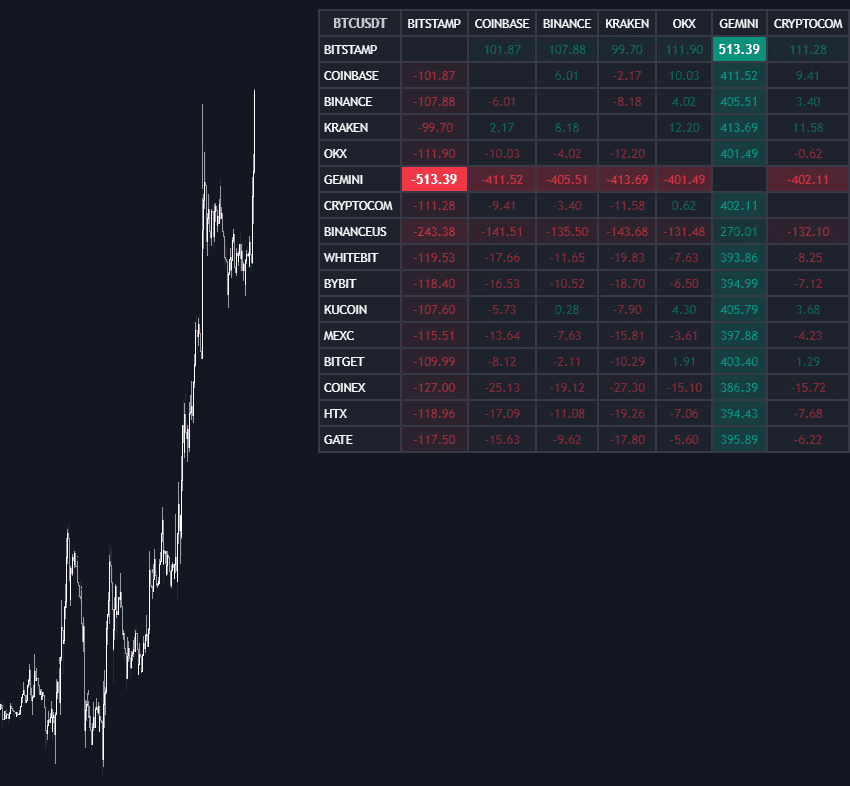
- For context: series composed from other markets, such as dollar strength against a currency basket or volume aggregated across exchanges, set the bias for the instrument actually being traded, a cross-instrument flavor of top-down analysis.
- As a regime input to single-instrument systems: a composite feeds the filter stage of a filter-setup-trigger-exit design, gating signals on the traded chart rather than generating them.
- For automation: composite series are watched with alerts and webhooks like any chart, so a spread crossing a threshold can notify the trader or trigger downstream order logic on the individual legs.
Cross-instrument Composition vs related approaches
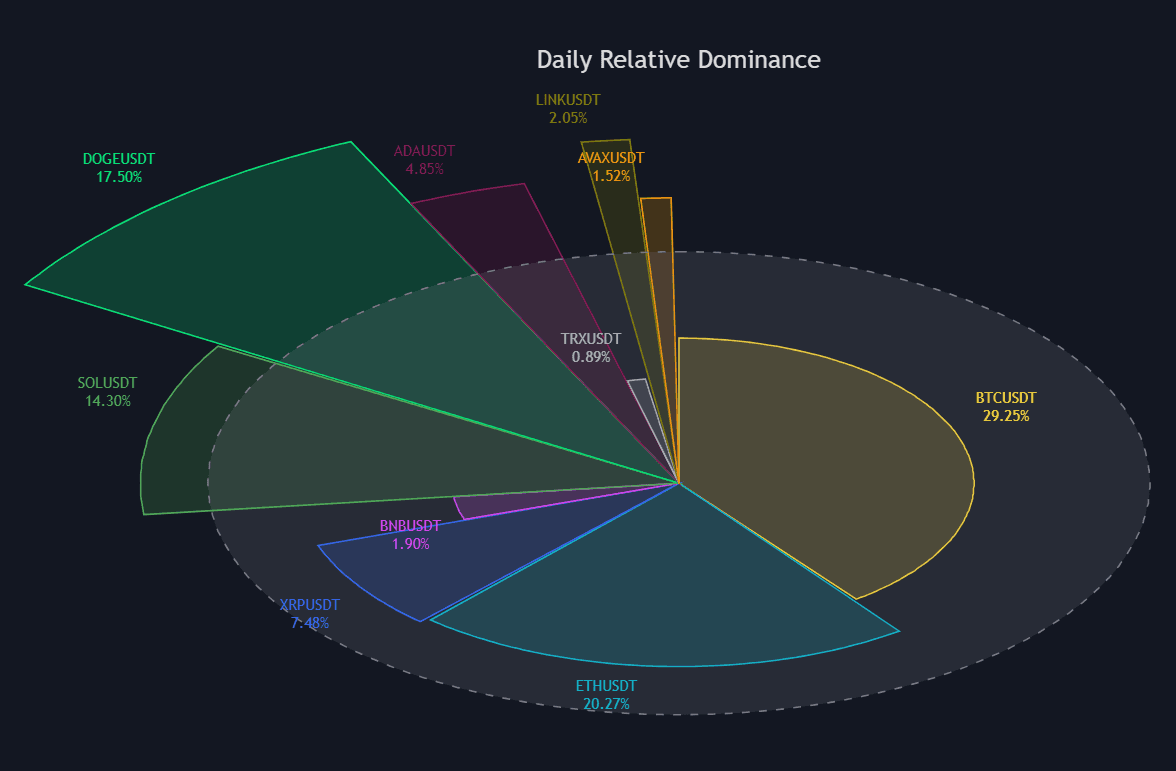
Custom Indices/baskets: A custom basket is one output of composition: several symbols merged into a single synthetic index. The umbrella also covers two-leg ratios, hedged spreads, and venue aggregation, where the goal is a relationship or a cleaner feed rather than an index.
Composite Oscillators: A composite oscillator blends several indicators computed on the same instrument into one line. Cross-instrument composition blends the instruments themselves before any indicator is applied: signal fusion versus data fusion.
Confluence & Scoring Systems: Confluence scoring counts agreement among signals to grade a setup and can sit on top of any chart, single or composite. Composition happens a layer earlier: it decides what series the signals are computed on in the first place.
Concept family
Meta & Composition
28 concepts mapped · 28 in the Library
Cross-instrument Composition FAQ
Turn Cross-instrument Composition into a trading strategy.
Take any implementation from this page into Quant, then build on it, backtest it on real data, and keep refining it in conversation.