Concept
Session Liquidity
Session Liquidity is a Smart Money Concepts / ICT concept. The Library holds 4 implementations, each one a working definition you can pull into Quant.
Asia high/low, London high/low
Top Session Liquidity indicators
The top custom implementations, built on the original standard Session Liquidity formula.
4 total
From studying Session Liquidity to trading it: take any implementation below into Quant and backtest it instantly.
What is Session Liquidity?
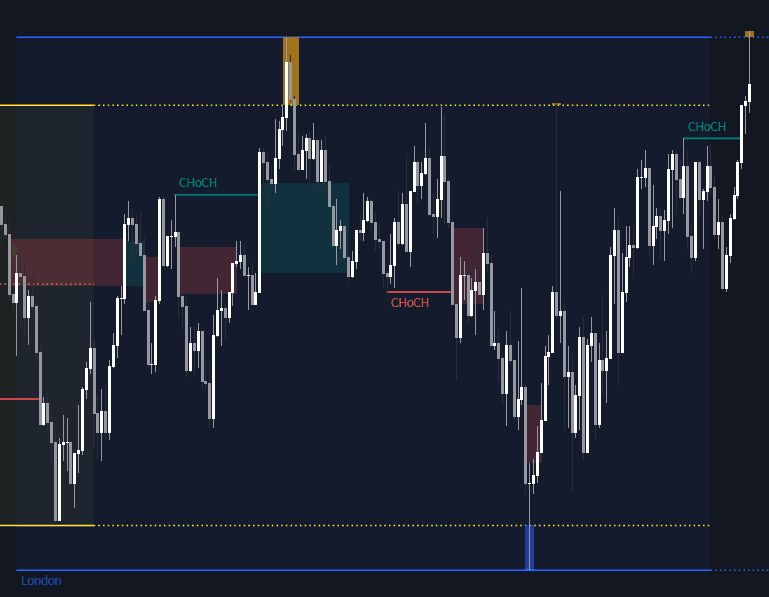
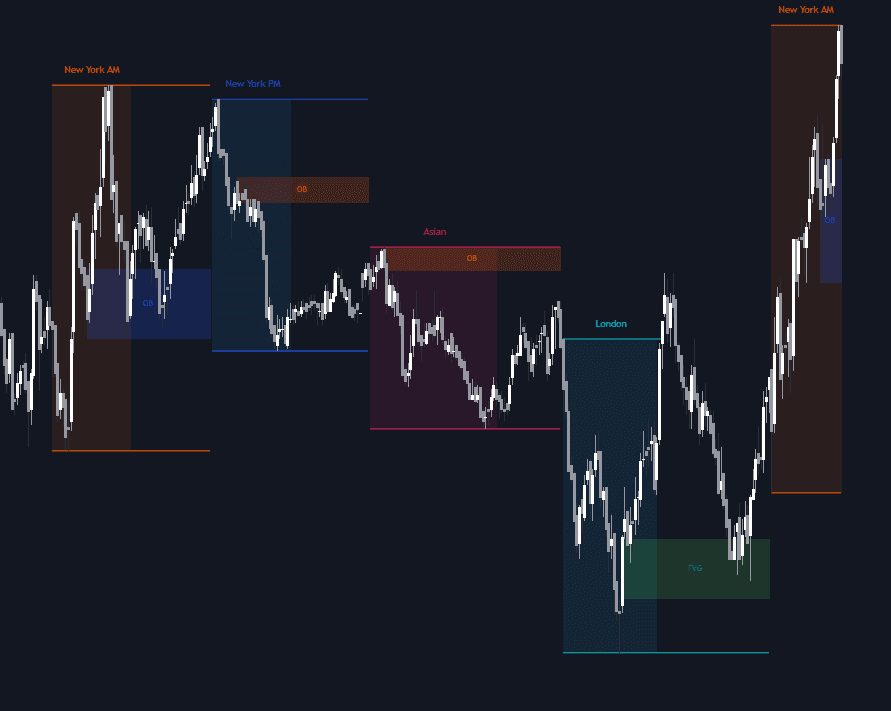
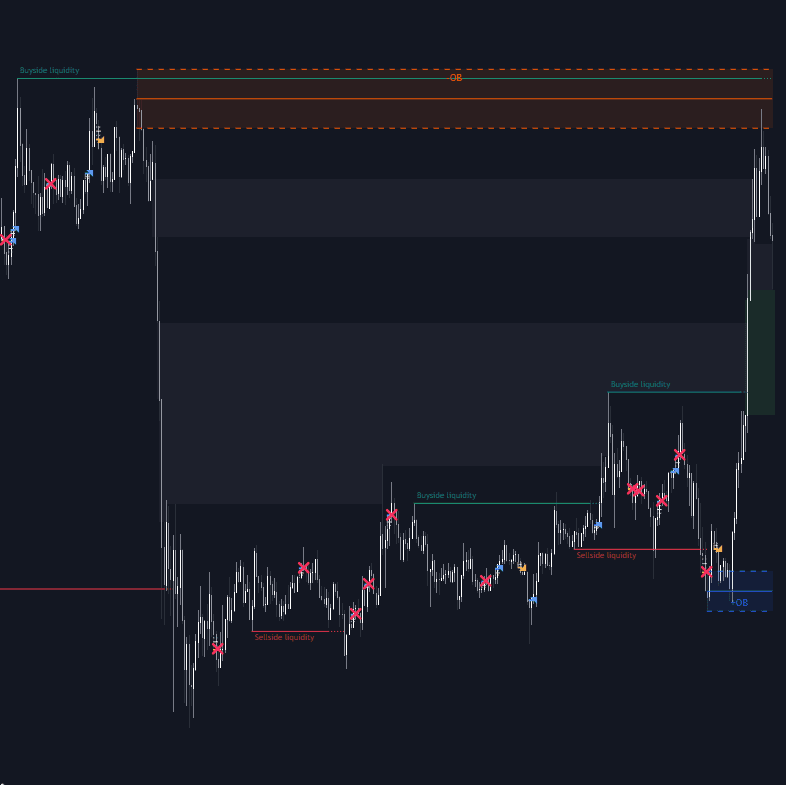
Session liquidity is the resting-order pool that builds at the high and low of each major trading session. The trading day divides into the Asian, London, and New York sessions, and every completed session leaves a visible range behind: above its high sit the stops of shorts and the entries of breakout buyers (buy-side liquidity), and below its low, the mirror-image sell-side liquidity. Because those extremes are obvious, widely watched reference levels, they become shared anchors for stop placement, which is exactly what loads them with orders.
Smart Money Concepts / ICT traders read those extremes as a schedule of targets: a later session frequently runs the high or low of an earlier one (London probing the Asian range, New York running London's extremes), consuming the triggered stops before the day's real expansion. A probe that trades through the level and snaps back inside is read as a liquidity sweep rather than a breakout. Neither outcome is owed (some session extremes simply break and trend), so the levels mark decision points, not predictions.
How to identify session liquidity
Session liquidity is session extremes plus the stops they attract, so mapping it is mostly disciplined bookkeeping.
- 1Divide the day into sessions (Asia, London, New York) using one fixed convention. Boundaries vary by market and tool; consistency matters more than the exact minutes.
- 2Mark the high and low of each completed session and project the lines forward: buy stops rest above each high, sell stops below each low.
- 3Retire a level once price trades through it; that pool is spent. Untouched extremes, especially from the most recent session, are the live ones.
- 4Watch how the next session treats a level: a fast probe that closes back inside the range reads as a sweep; sustained acceptance beyond it reads as expansion, not a grab.
How it's calculated
Session highs and lows are treated as resting liquidity levels that stay active on the chart until price trades through them.
Session hours vary by platform and market and shift with daylight saving; there is no single standard clock.
Some tools keep only the most recent session's levels, others keep every level until it is swept.
The same construction is applied to previous day, week, and month highs and lows in most SMC toolkits.
How traders use it
- As a target map, the nearest untouched session extreme is a natural draw on liquidity: longs work toward a prior session high, shorts toward a prior session low, and profit is commonly taken into the pool rather than beyond it, since the level is where opposing interest is likeliest to appear.
- As a reversal setup, the classic sequence is one session running another's extreme and failing: London sweeping the Asian low and then displacing higher is the textbook Judas swing. Most models require the rejection plus a structure shift before acting, not the touch alone.
- As a bias read, which side of the prior session's range is taken first, and whether price accepts or rejects beyond it, frames the day: rejection argues for rotation back through the range, acceptance for one-sided expansion.
- As timing context, a session-extreme sweep that occurs in the opening hours of London or New York carries more weight in ICT-style models than the same level breaking during the dead hours between sessions.
Session liquidity vs related concepts
Equal Highs/lows As Liquidity: Equal highs and lows flag liquidity by pattern: two or more matched extremes imply stacked stops wherever they appear. Session liquidity flags it by time: the extreme matters because a session printed it, even when nothing about its shape stands out.
Prior Period Levels: Prior-period levels are calendar extremes: yesterday's or last week's high and low. Session liquidity slices the same day into Asia, London, and New York, giving several intraday reference pairs instead of one; the stop-run logic at both is identical.
Killzones: Killzones are windows of time in which setups are hunted; session liquidity is the set of price levels sessions leave behind. They pair constantly (a sweep of the Asian high during the London killzone is a classic sequence), but one answers when, the other where.
More Session Liquidity implementations
Concept family
Smart Money Concepts / ICT
54 concepts mapped · 54 in the Library
Session Liquidity FAQ
Turn Session Liquidity into a trading strategy.
Take any implementation from this page into Quant, then build on it, backtest it on real data, and keep refining it in conversation.