Concept
R-multiple Framework
R-multiple Framework is a Risk, Sizing & Exits concept. The Library holds 3 implementations, each one a working definition you can pull into Quant.
Top R-multiple Framework indicators
The top custom implementations, built on the original standard R-multiple Framework formula.
3 total
Any of the 3 R-multiple Framework implementations below can become a backtested trading strategy — describe your rules and Quant writes the code.
.png&w=3840&q=75)
What is the R-multiple Framework?
The R-multiple framework expresses every trade outcome as a multiple of its initial risk. R is the amount put at risk at entry: the distance from entry to stop, times position size. A trade stopped for its full risk is -1R; a trade that returns twice what it risked is +2R. Popularized by Van Tharp, the convention turns a ledger of dollar results across different instruments, sizes, and account balances into a single comparable distribution of R-multiples.
Tharp spread the vocabulary through Trade Your Way to Financial Freedom (1998) and later work, crediting the underlying idea to traders he studied, and judged system quality by the distribution of R-multiples a method produces rather than its win percentage. The convention became common in trading journals because it separates two things raw P&L mixes together: how good the entries and exits were, and how big the bets happened to be.
That normalization is the point. Expectancy becomes the average R per trade, a function of win rate and the relative size of winners and losers in R terms. Paired with fixed fractional sizing, where every trade risks the same fraction of equity, 1R maps to a known slice of the account, so losing streaks can be reasoned about in trade counts instead of dollars. The framework stays honest only if R is recorded from the original stop: widening a stop mid-trade quietly redefines what -1R was supposed to mean.
The accounting has practical edges. Scaling out turns one trade into several partial outcomes to blend into one R figure; trailed exits from the trailing method taxonomy make realized R depend on exit management, not just target choice; and the stop that defines 1R can come from different logic, a structure stop behind a swing point or a volatility stop at a multiple of average range. None of that breaks the framework; it only requires that initial risk be written down at entry and every outcome measured against it.
How to work in R on a chart
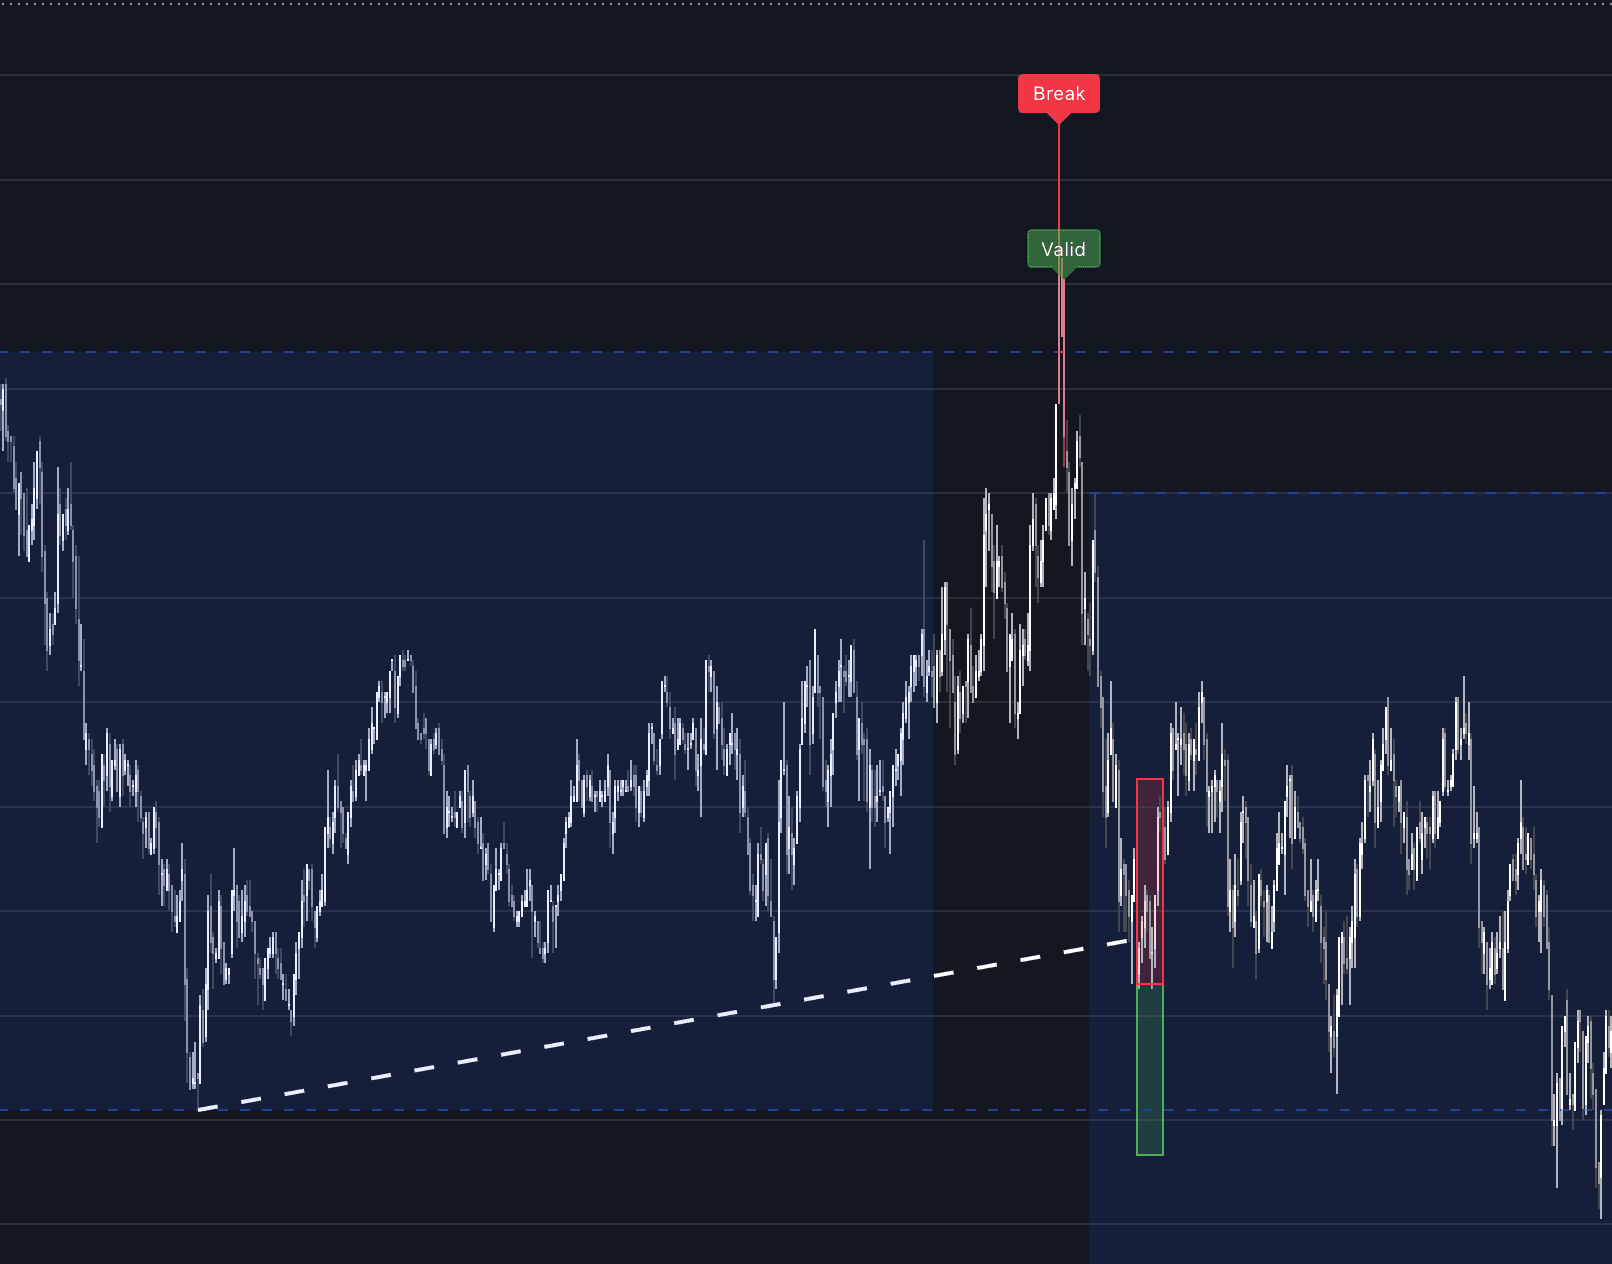
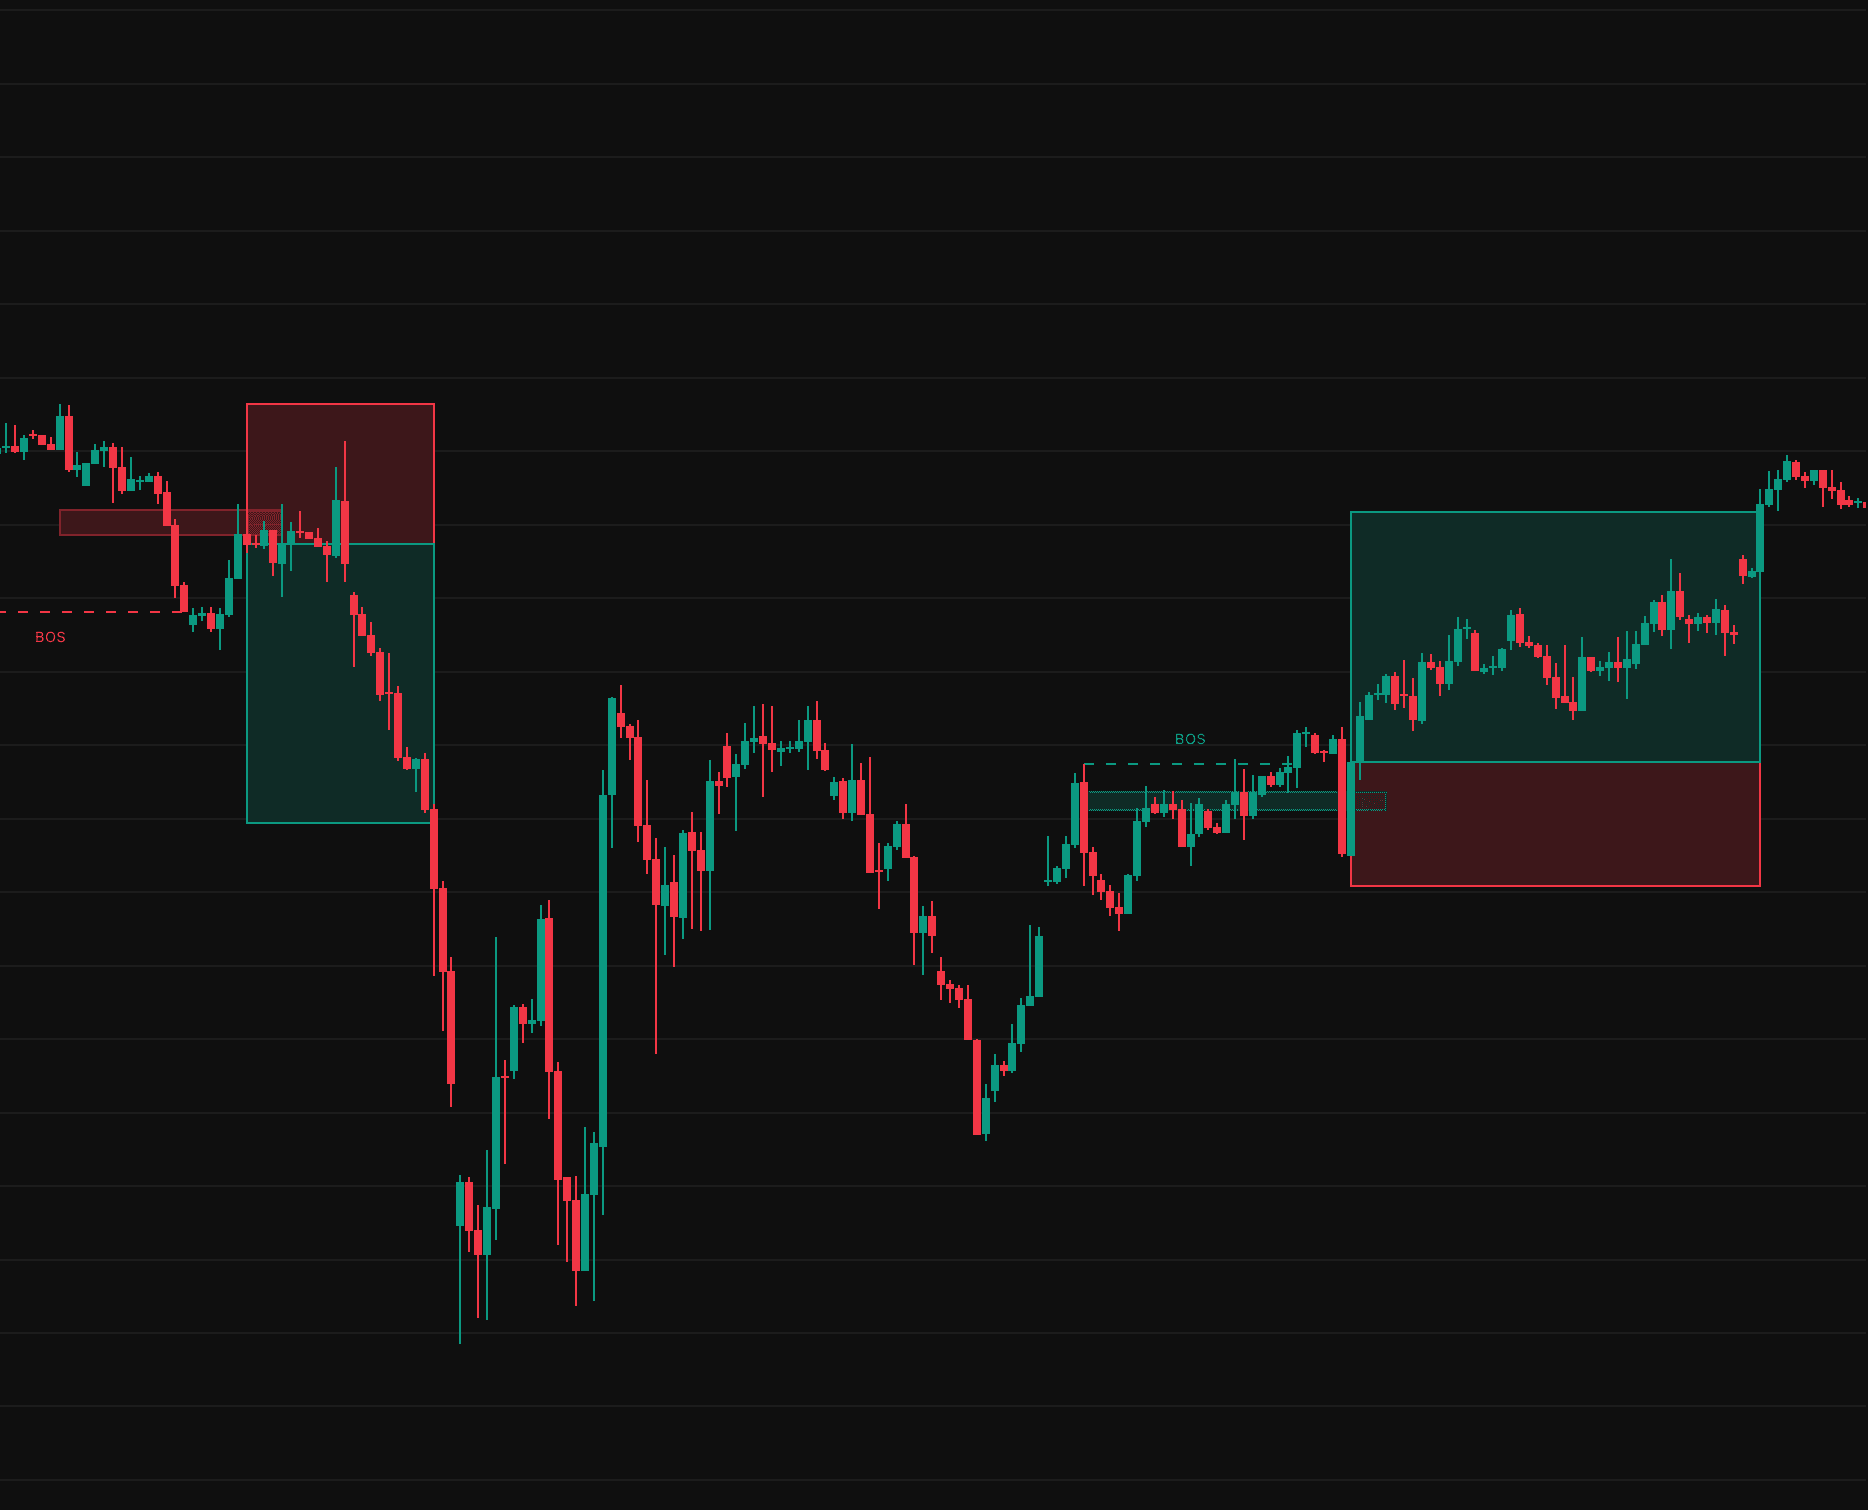
R-multiples are bookkeeping more than a plotted study, but position tools and risk overlays draw them directly on the chart.
- 1Define the entry and the initial stop; their distance times position size is 1R, and nothing else on the trade is defined until it is.
- 2Project multiples of that distance in the trade's direction to mark +1R, +2R and +3R; position tools render these as shaded reward boxes.
- 3Read prospective targets in R: one at a prior high sitting 1.4R away is a 1.4R trade regardless of the dollars involved.
- 4After the exit, record exit-minus-entry divided by entry-minus-stop for longs, signed the other way for shorts; that number is the trade's R-multiple.
How it's calculated
Expresses every trade's outcome as a multiple of R, the risk between entry and the initial stop, so results and expectancy are comparable across trades.
R is fixed by the initial stop and is not restated when the stop later trails; a +2R result means the trade earned twice its initial risk.
Expectancy is the mean R earned per trade and can equivalently be written as win rate × average win in R minus loss rate × average loss in R (framework popularized by Van Tharp).
Include fees and slippage in the exit price so reported multiples stay honest.
How traders use it
- For journaling: every closed trade is logged as an R-multiple, so expectancy and the shape of the outcome distribution can be tracked without the noise of varying position sizes and instruments.
- For pre-trade geometry: targets are quoted in R against a 1R stop, making reward-to-risk explicit before entry; see the profit target taxonomy for how those objectives get placed.
- For comparing systems: strategies on different markets or account sizes can be ranked on average R, R distribution, and worst R streaks, because the unit already accounts for what was risked.
- For sizing: given a risk fraction and a defined 1R in price, position size falls out arithmetically; the choice of denominator is its own decision, covered under sizing bases.
- For circuit breakers: daily loss-control rules read cleaner in R than in currency, halting after -3R on the day for example, since the rule scales with the account.
R-multiples vs adjacent risk concepts
Fixed Fractional: Fixed fractional answers how much to risk, a set percentage of equity per trade; R-multiples answer how to measure what happened relative to that risk. They interlock: fixed fractional keeps 1R a constant share of the account, which keeps R-multiples comparable over time.
Volatility-targeted Sizing: Volatility targeting sets exposure so a position's expected fluctuation matches a budget, defining risk from return variability rather than stop distance. R-multiples require a hard stop to define 1R; the two coexist when a volatility-derived stop supplies that distance.
Profit Target Taxonomy: Target taxonomies describe where objectives can be placed: at structure, measured moves, or fixed multiples. The R framework is the measuring stick those targets are quoted in; a structural target only becomes a 2.3R trade once the stop defining R is fixed.
Concept family
Risk, Sizing & Exits
37 concepts mapped · 37 in the Library
R-multiple Framework FAQ
Turn R-multiple Framework into a trading strategy.
Take any implementation from this page into Quant, then build on it, backtest it on real data, and keep refining it in conversation.