HTF Candle Overlay
HTF Candle Overlay, also known as higher-timeframe candle overlay, HTF candles, HTF candle projection, multi-timeframe candles, is a Meta & Composition concept. The Library holds 1 implementation, a working definition you can pull into Quant.
Top HTF Candle Overlay indicator
The top custom implementation, built on the original standard HTF Candle Overlay formula.
1 total
From studying HTF Candle Overlay to trading it: take the implementation below into Quant and backtest it instantly.
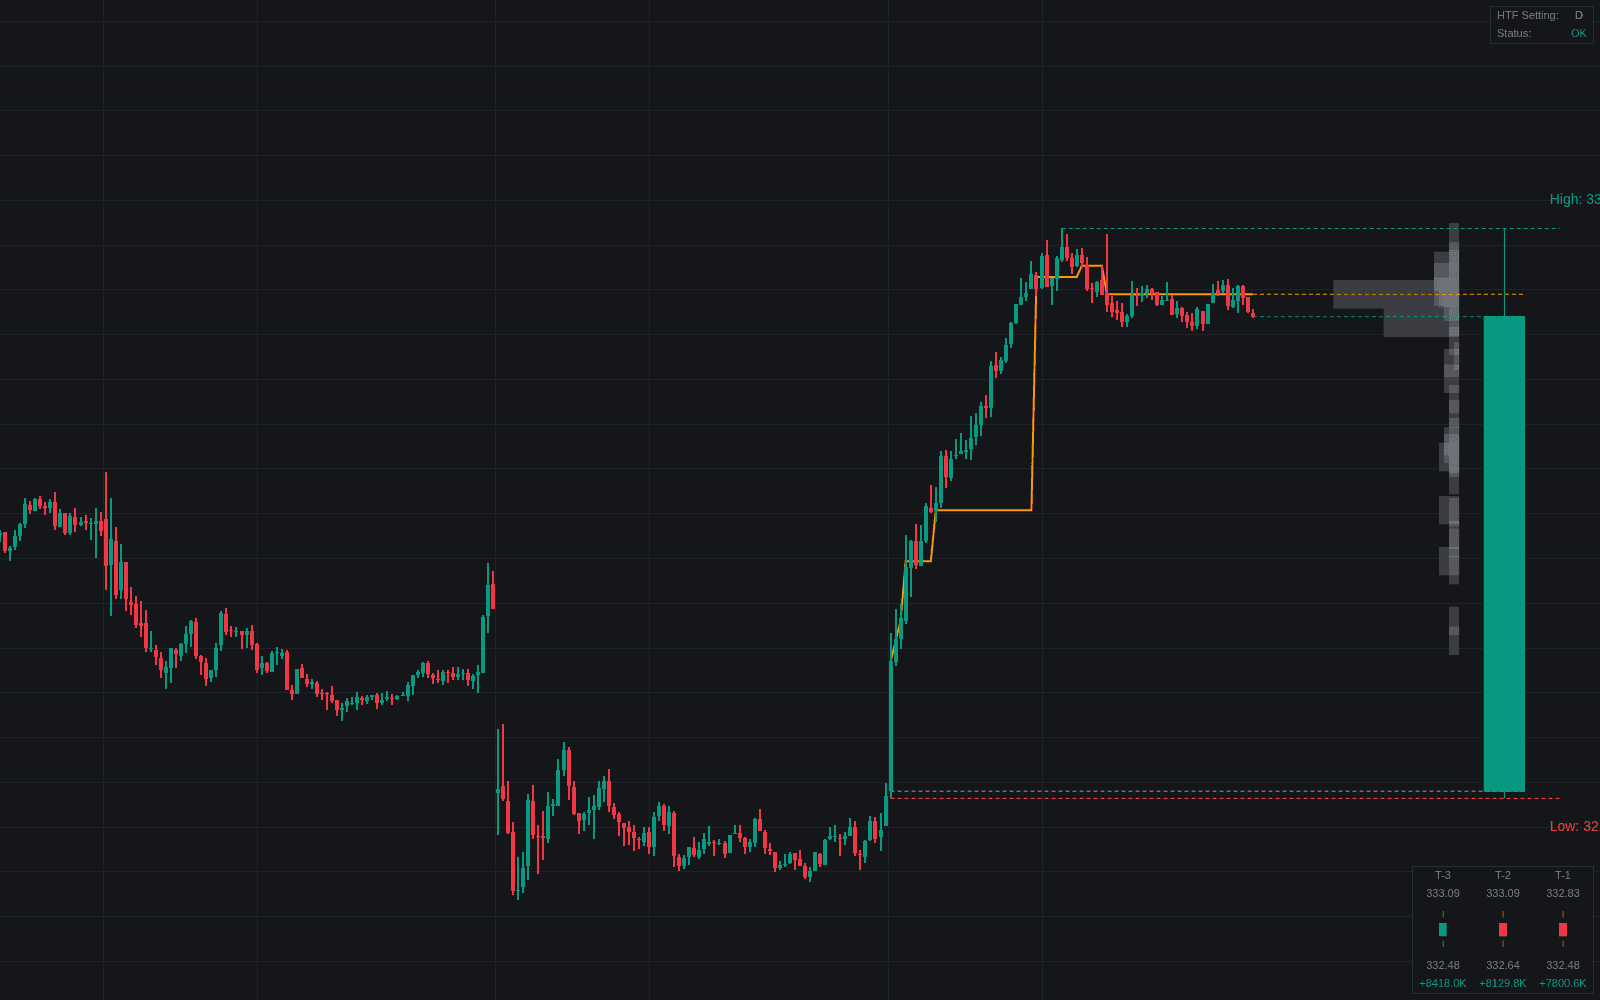
What is a Higher-timeframe Candle Overlay?
A higher-timeframe (HTF) candle overlay draws the candles of a larger timeframe on the chart you execute from, including the one still forming. A trader on the 5-minute chart sees the day's candle being built bar by bar, its open, high, low and close updating live, alongside the last few completed daily candles. The point is to read the higher-timeframe candle while acting on the lower one, without switching charts.
Two display styles dominate. Projections draw the HTF candles in the empty space right of the last bar, at their true prices, so the developing candle sits beside current price like a second, slower chart. Background overlays draw each HTF candle behind the lower-timeframe bars that built it, a shaded body with wick lines spanning the period, showing which bars made the high, the low and the close. Both usually extend the HTF open, high and low as lines, the prices most candle-based models trade against.
Several methods are, at bottom, readings of one higher-timeframe candle. Power of Three asks whether the day has made its false move beyond the open yet; Candle Range Theory asks whether the current candle has swept the previous one's high or low and closed back inside; The Strat asks whether price is above or below each timeframe's open. Each question concerns an unfinished candle, and an overlay shows that candle as it forms. It is a display, not a signal: the developing candle changes until its period closes, and a wick that looks like rejection at midday can be a full body by the close.
How it's calculated
The developing HTF candle is an aggregation of the lower-timeframe bars inside the current HTF period.
Period boundaries follow the instrument's session and timezone settings, so a daily candle on a futures chart and on a crypto chart start at different clock times.
On futures, the official daily close is often a settlement price, which can differ from the last intraday trade an aggregation uses.
How traders use it
- As a live bias read: many traders take lower-timeframe setups only in the direction of the developing daily or weekly candle, and only while price holds on that side of its open.
- For candle-anatomy models: Power of Three and CRT traders track the developing candle's open, its first excursion and the previous candle's extremes in real time, exactly what an overlay keeps on screen.
- As self-updating levels: the HTF open and the previous and developing highs and lows double as period opens and prior period levels without manual drawing.
- For internals: some overlays add what happened inside the candle, such as the share of bullish versus bearish lower-timeframe bars, an intraperiod volume profile with its point of control, or a running volume delta.
- In LuxAlgo builds: HTF Candle Projections draws recent and live HTF candles right of price, tracing each wick to the bar that printed it; HTF Candle Dynamics adds live OHLC levels and an intraperiod volume profile; HTF PO3 projects Power of Three candles with a running delta.
HTF candle overlay vs related composition tools
Top-down Analysis: Top-down analysis is the process: read higher timeframes first, execute lower. The overlay is a display that keeps one higher timeframe in view during execution; it adds no rules of its own.
Prior Period Levels: Prior period levels are closed periods' highs, lows and closes drawn as lines. An overlay shows those plus the developing candle, so its open, range and close are read live rather than once the period ends.
Accumulation-manipulation-distribution: PO3 is a reading of the HTF candle (open, false move, true move); the overlay is the display that lets you make that reading while the candle forms rather than after it closes.
Concept family
Meta & Composition
23 concepts mapped · 23 in the Library
HTF Candle Overlay FAQ
Turn HTF Candle Overlay into a trading strategy.
Take the implementation from this page into Quant, then build on it, backtest it on real data, and keep refining it in conversation.