Concept
Fib Wave Relationships
Fib Wave Relationships are Elliott & Harmonics concepts. The Library holds 1 implementation, a working definition you can pull into Quant.
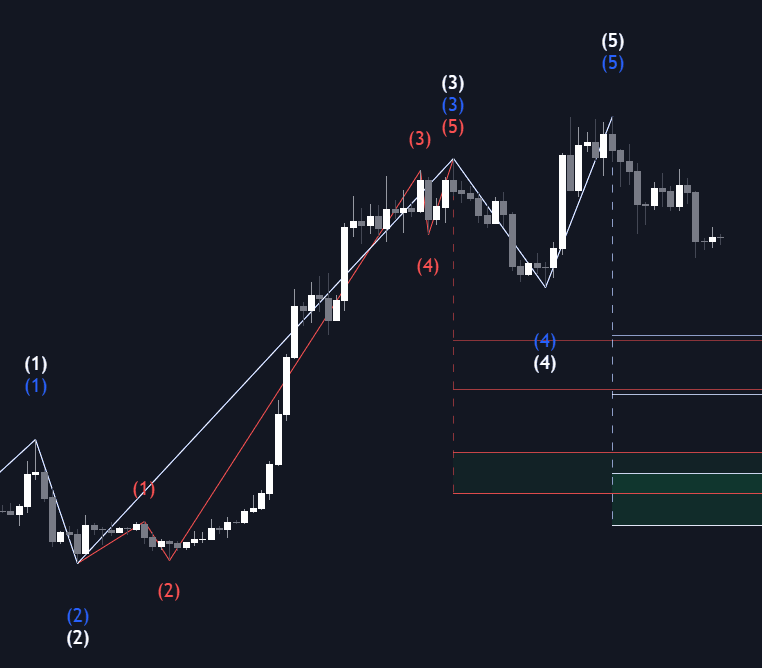
2 = 0.5–0.618 of 1. 3 = 1.618–2.618. 4 = 0.236–0.382. 5 = 0.618–1.0
Top Fib Wave Relationships indicator
The top custom implementation, built on the original standard Fib Wave Relationships formula.
1 total
This Fib Wave Relationships implementation is strategy-ready: open it in Quant, set your rules, and it backtests automatically.
What are Fib Wave Relationships?
Fib wave relationships are the Fibonacci proportions Elliott practitioners use to relate waves to one another: guidelines for how long a wave tends to be relative to the waves before it. Commonly cited ranges for an impulse: wave 2 retraces 0.5 to 0.618 of wave 1, wave 3 extends to 1.618 to 2.618 times wave 1, wave 4 retraces 0.236 to 0.382 (usually measured against wave 3), and wave 5 runs 0.618 to 1.0 times wave 1. In corrections, wave C is commonly projected at equality with wave A or at 1.618 times it. Exact ranges vary by source; these are tendencies drawn from the Elliott literature, not laws.
The Fibonacci basis was Elliott's own late addition: he connected his wave counts to the sequence in his final work, and the Frost-Prechter tradition systematized the ratio guidance that modern practice quotes. The result is a two-layer system, structure from the wave rules, measurement from the ratio set, with the proportions serving as the count's arithmetic conscience.
The relationships convert a wave count from a narrative into measurable, testable prices. Retracement ratios are read with a fib retracement across the prior wave; multiples of a completed wave are projected forward with a three-point fib projection. They also separate cleanly from the Elliott hard rules: a rule violation kills a count outright, while a missed relationship merely makes it less typical. Where several relationships point at the same price, for instance a wave 5 projection landing on a larger-degree retracement, the overlap forms the kind of confluence practitioners treat as a meaningful target zone.
Two guidelines discipline the measurements. Alternation warns that waves 2 and 4 tend to differ in character and depth, so identical retracements in both is atypical; and degree consistency demands that proportions make sense at each scale of the nested count, a wave 3 of one degree simultaneously serving as waves 1-through-5 of the smaller one. Practitioners also keep the equality guideline close: when wave 3 extends, waves 1 and 5 tend toward equality, the relationship that most often nominates fifth-wave terminal zones.
How to measure wave relationships
Every measurement is anchored on labeled wave extremes; the relationships grade the count as it develops.
- 1Label the count first under the hard rules; relationships refine legal counts rather than rescue illegal ones.
- 2Measure retracements across the prior wave: wave 2 as a fraction of wave 1, wave 4 as a fraction of wave 3, watching the typical bands (deep for 2, shallow for 4).
- 3Project the actionary waves with three-point tools: wave 3 as multiples of wave 1 from the wave-2 low, wave 5 from the wave-4 low, wave C from the B point.
- 4Apply alternation: waves 2 and 4 matching in depth and shape argues the count is forced.
- 5Check equality when 3 extends: wave 5 near 1.0 of wave 1 is the standard terminal expectation in extended-third impulses.
- 6Stack the projections across degrees: overlapping measurements from different scales form the target zones worth planning around.
How it's calculated
Fibonacci ratio guidelines that relate Elliott wave lengths to one another for retracement checks and target projection.
These are the guideline ratios from Frost and Prechter's Elliott Wave Principle, not strict rules; counts satisfying more of them are considered better formed.
The strict rules are separate: wave 2 never retraces past the start of wave 1, wave 3 is never the shortest, and wave 4 does not enter wave 1 price territory in a standard impulse.
For large percentage moves, some analysts measure the ratios on a log scale.
How traders use it
- For price targets: project wave 3 from the end of wave 2 as a multiple of wave 1, wave 5 from the end of wave 4, and the C leg of a corrective wave at equality with wave A; the projections give a count concrete objectives.
- For count selection: when two labelings are both legal under the hard rules, the one whose waves land near common proportions is usually preferred, and unusual proportions everywhere is a hint the count is forced.
- As early warning: relationships degrade before rules break. A wave 2 pushing past 0.786 toward a full retracement has not invalidated anything yet, but it is already outside the typical range, so exposure gets reduced before the hard stop.
- For confluence zones: overlapping projections from different degrees, or a projection meeting a channel line or prior level, mark the areas where practitioners look for fifth waves and C waves to terminate.
- In complex corrections: equality between the W and Y legs of double corrections, and the standard C-versus-A ratios, extend the same measuring discipline to sideways structures, where proportions often carry more information than shape.
Fib Wave Relationships vs related concepts
Elliott Hard Rules: The rules are binary: wave 2 exceeding 100%, a shortest wave 3, or a 1-4 overlap invalidates the count. Fib relationships are soft expectations about typical proportions; missing one costs a count plausibility, not validity.
Harmonic & Fib Ratio Set: The ratio set is the raw vocabulary of levels shared across fib tools and harmonic patterns. Fib wave relationships are one specific application: mapping those ratios onto wave proportions within an Elliott count.
Fib Extension: The extension tool projects ratios beyond a single swing with no wave framework attached. Wave relationships use the same arithmetic but tie each measurement to a labeled wave and its role in the count.
Concept family
Elliott & Harmonics
33 concepts mapped · 33 in the Library
Fib Wave Relationships FAQ
Turn Fib Wave Relationships into a trading strategy.
Take the implementation from this page into Quant, then build on it, backtest it on real data, and keep refining it in conversation.