Concept
ABCD
ABCD, also known as extended ABCD, is a Elliott & Harmonics concept. The Library holds 1 implementation, a working definition you can pull into Quant.
Top ABCD indicator
The top custom implementation, built on the original standard ABCD formula.
1 total
Want to trade ABCD? The implementation below is one prompt away from a backtested strategy in Quant.
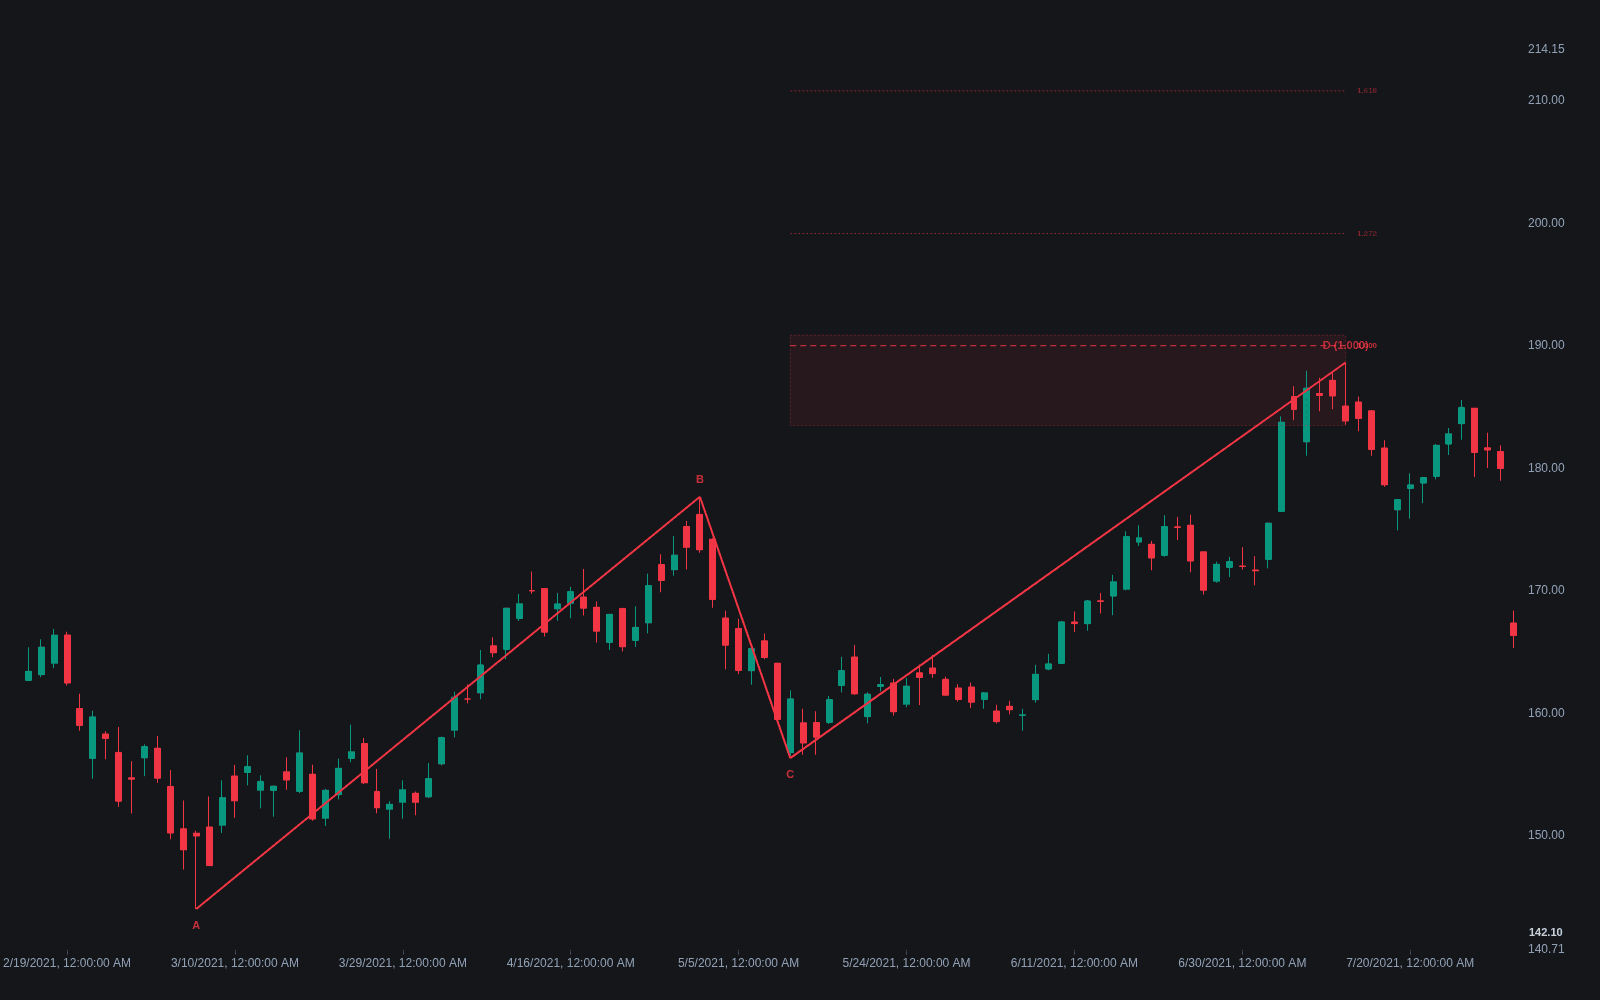
What is an ABCD?
The ABCD, often written AB=CD, is the simplest of the harmonic patterns: two price legs of matching length separated by a correction. Price travels from A to B, corrects to C (commonly 0.618 to 0.786 of AB), then travels from C to D until CD equals AB in price distance. In the common reading the completion also lands near a 1.27 to 1.618 extension of the BC leg, and the extended ABCD variant substitutes CD equal to 1.27 or 1.618 times AB when exact equality fails.
The measurement is usually traced to H.M. Gartley's Profits in the Stock Market (1935), with the ratio-driven modern version owed to later practitioners such as Larry Pesavento and Scott Carney. It works as the building block of the larger XABCD patterns: an AB=CD finishing at the D point is part of what defines a Gartley. Some practitioners also weigh time symmetry, preferring patterns where AB and CD consume a comparable number of bars. Equality is a zone to watch for reaction, not a wall; trending markets push through it routinely.
In Carney's formulation the ratios pair reciprocally: a shallow 0.618 retracement at C points to a deeper 1.618 BC projection, while a deep 0.786 retracement pairs with 1.27. The broader harmonic and Fib ratio set built from these relationships turns four pivots into a measurement rather than a shape, and where the AB=CD completion, the BC projection, and larger-context levels agree, that confluence defines a potential reversal zone, the harmonic trader's actual trading object.
The same geometry lives inside Elliott Wave Theory: a zigzag whose C wave equals its A wave traces an AB=CD, one of the standard Fib wave relationships. Whether framed as a corrective wave ending or a harmonic completion, it expresses the same observation: swings in liquid markets often travel in roughly equal legs, and the end of the second leg is a natural place for the larger flow to reassert itself.
How to identify an ABCD pattern on a chart
The pattern is measured, not eyeballed; identification is disciplined use of a Fibonacci tool.
- 1Anchor A at a swing extreme and B where the first leg ends; AB should be a clean directional impulse, not a drift.
- 2Track the retracement to C: textbook patterns hold C between 0.618 and 0.786 of AB, and C must never exceed A, or the structure is void.
- 3Project D two ways, the length of AB measured from C and the 1.27 to 1.618 extension of BC; agreement between the projections makes the level worth watching.
- 4For the extended variant, also mark 1.27 and 1.618 multiples of AB from C; markets that overrun exact equality often react near the next multiple.
- 5Compare AB and CD bar counts if you weigh time symmetry, then let price reach the zone and show a reaction; a projection without a completed CD leg is a forecast, not a pattern.
How it's calculated
A four-point harmonic pattern whose final leg mirrors the first, completing at a measured point D.
The extended ABCD sets abs(D - C) = 1.272 × abs(B - A) or 1.618 × abs(B - A) instead of equality.
The ratios are tolerance zones rather than exact requirements.
Time symmetry, with CD lasting about as many bars as AB, is often preferred.
How traders use it
- To project a completion in advance: once A, B, and C are in place, D is measurable (the length of AB projected from C), so traders set alerts or resting orders around the level and evaluate the reaction when price arrives.
- As a defined-risk reversal entry: at D, traders look for confirmation, place stops beyond the completion (or beyond the 1.27 extension when tracking the extended variant), and stage targets at retracements of the CD leg.
- As a component inside larger structures: XABCD detectors typically require an AB=CD or extended ABCD to terminate at the same place as the pattern's D point before flagging a Gartley, Bat, or Butterfly.
- With trend filtering: completions that rejoin the larger motive wave or dominant trend are graded above countertrend ones, on the logic that the turn at D has the bigger flow behind it.
ABCD vs related patterns
Three Drives: Three Drives chains three symmetric pushes to successive extremes with corrective pullbacks between them; the ABCD is a single two-leg symmetry, and a Three Drives often contains overlapping ABCD measurements.
Gartley: The Gartley is a five-point pattern anchored at X whose D typically combines a 0.786 XA retracement with an AB=CD completion; the ABCD alone carries no X anchor and no retracement requirement against a prior leg.
Butterfly: The Butterfly's D completes beyond the X extreme, typically near a 1.27 XA projection with an extended AB=CD inside it. A plain ABCD needs no prior X leg and completes wherever its own symmetry lands.
Concept family
Elliott & Harmonics
33 concepts mapped · 33 in the Library
ABCD FAQ
Turn ABCD into a trading strategy.
Take the implementation from this page into Quant, then build on it, backtest it on real data, and keep refining it in conversation.