Concept
kNN Analog Forecasting
kNN Analog Forecasting, also known as nearest-neighbor pattern matching, is a Machine Learning concept. The Library holds 7 implementations, each one a working definition you can pull into Quant.
Top kNN Analog Forecasting indicators
The top custom implementations, built on the original standard kNN Analog Forecasting formula.
7 total
Any of the 7 kNN Analog Forecasting implementations below can become a backtested trading strategy — describe your rules and Quant writes the code.
.png&w=3840&q=75)
What is kNN Analog Forecasting?
kNN analog forecasting applies the k-nearest-neighbors method to price history. The current market state is encoded as a vector, typically a window of recent normalized returns, prices, or indicator readings assembled through feature engineering. The algorithm searches the historical record for the k windows most similar to the present one, usually by Euclidean distance, and treats what followed those analogs as the forecast: averaging the subsequent paths gives a projection, letting the neighbors vote gives a directional call. It is memory-based learning. There is no training step and no fitted equation, only the stored history plus a handful of design choices: the features, the window length, the distance measure, and k.
The appeal is transparency: you can inspect exactly which past episodes drive today's forecast, making it the quantitative version of the analog charts traders have long drawn. The weaknesses are equally concrete. Markets are non-stationary, so states that look alike in feature space are not guaranteed to resolve alike; adjacent historical windows overlap, so neighbors are rarely independent; and everything hinges on normalization (z-scores or min-max scaling are typical), because raw price levels from different years are not comparable. Treat the output as a set of historical scenarios, not a prediction.
How to build a kNN analog forecast
Every implementation follows the same four moves; the choices inside each one are where results diverge.
- 1Encode the present: choose features and a window length, normalize them, and stack the recent values into a single vector.
- 2Measure similarity: compute the distance, usually Euclidean, between that vector and every comparable window in the historical record.
- 3Select neighbors: keep the k smallest distances, ideally skipping windows that overlap one another so the analogs are closer to independent.
- 4Aggregate outcomes: average the k subsequent paths for a projection, or tally each neighbor's resolution for a directional vote, optionally weighting nearer neighbors more.
How traders use it
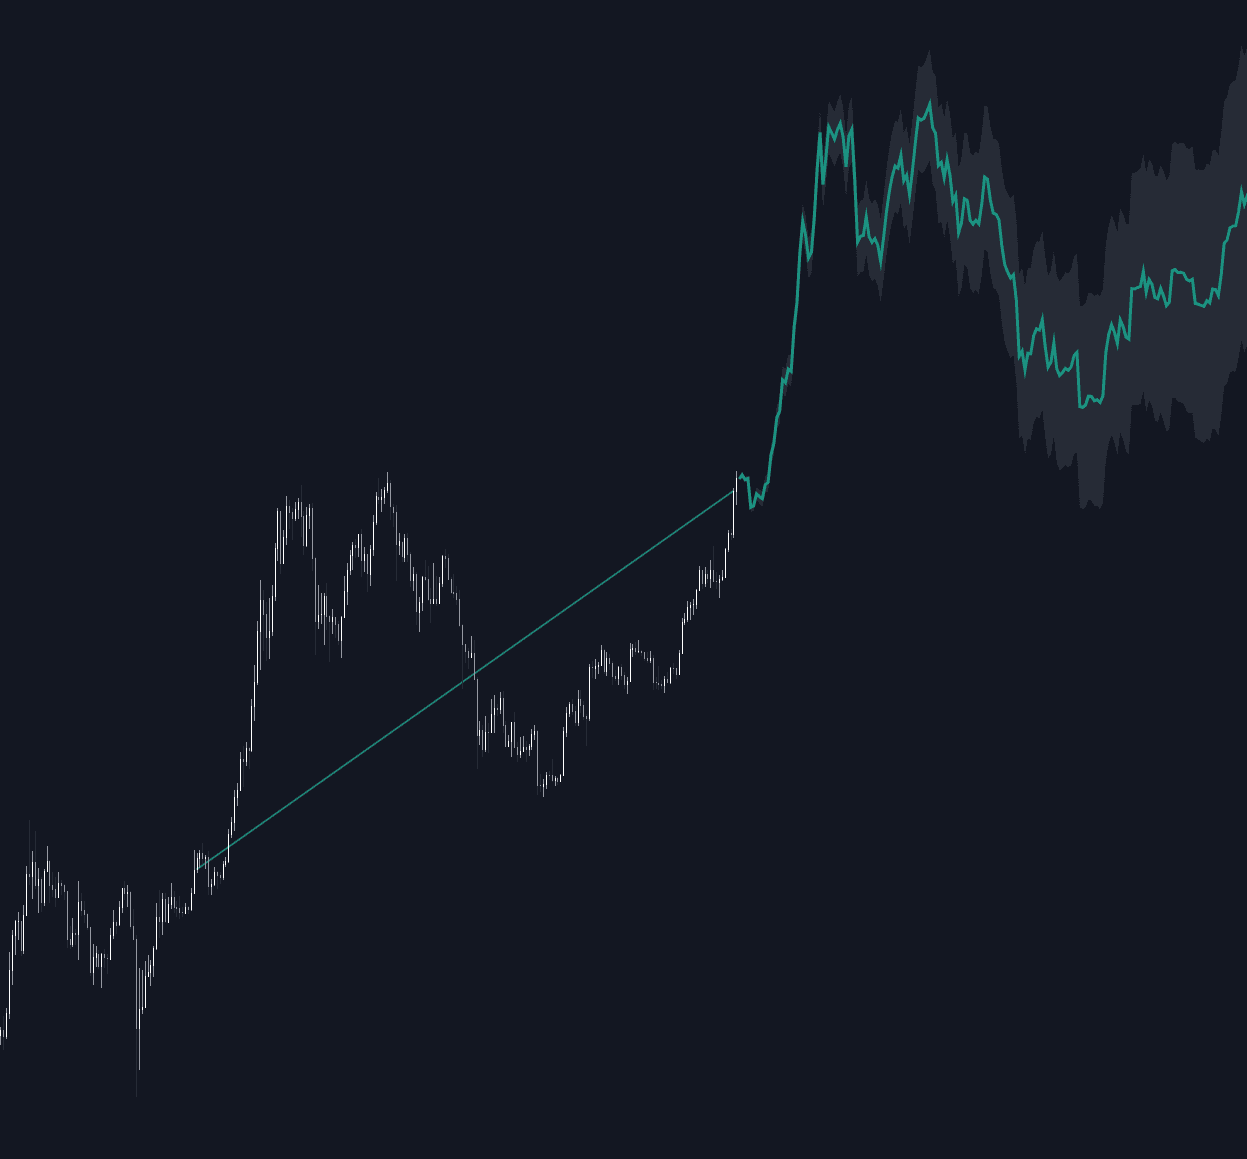
- As projection overlays: the paths that followed the nearest historical analogs are averaged and drawn forward from the current bar, a data-driven forecast curve rather than a model-based extrapolation.
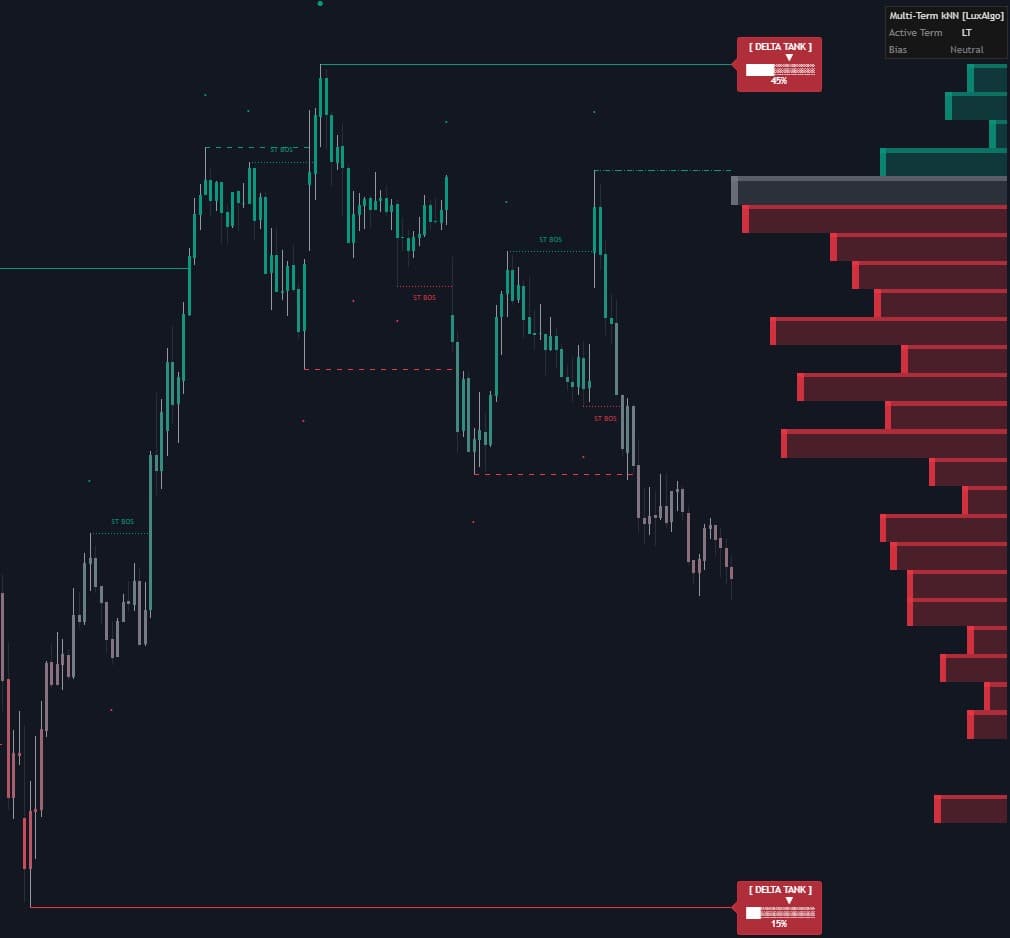
- As a direction classifier: each neighbor votes up or down over the chosen horizon and the majority becomes the bullish or bearish reading; inputs are often oscillator values such as RSI rather than raw price.
- As a filter on a base system: before a rule-based signal fires, the kNN layer checks whether similar past states resolved favorably and suppresses entries whose analogs performed poorly.
- With honest validation: neighbors come from the same history the signal is judged on, so look-ahead leaks in easily; an in-sample / out-of-sample split or walk-forward test is the minimum before trusting reported accuracy.
kNN Analog Forecasting vs related methods
Monte Carlo Price Paths: Monte Carlo also projects forward paths, but it samples randomly from a return distribution; kNN replays specific historical episodes selected for their similarity to the present state.
Exponential Smoothing Forecasts: Exponential smoothing extrapolates a fitted level, plus a trend term in trended variants, from recent data; kNN assumes no functional form and forecasts from whatever the closest historical matches actually did next.
Kernel Regression: Kernel regression weights every observation continuously by distance; kNN makes a hard cut, using only the k closest matches and ignoring the rest of the record entirely.
More kNN Analog Forecasting implementations
Concept family
Machine Learning
32 concepts mapped · 32 in the Library
kNN Analog Forecasting FAQ
Turn kNN Analog Forecasting into a trading strategy.
Take any implementation from this page into Quant, then build on it, backtest it on real data, and keep refining it in conversation.