Concept
Exponential Smoothing Forecasts
Exponential Smoothing Forecasts, also known as Holt double exponential, Holt-Winters triple, are Statistics concepts. The Library holds 1 implementation, a working definition you can pull into Quant.
Top Exponential Smoothing Forecasts indicator
The top custom implementation, built on the original standard Exponential Smoothing Forecasts formula.
1 total
From studying Exponential Smoothing Forecasts to trading it: take the implementation below into Quant and backtest it instantly.
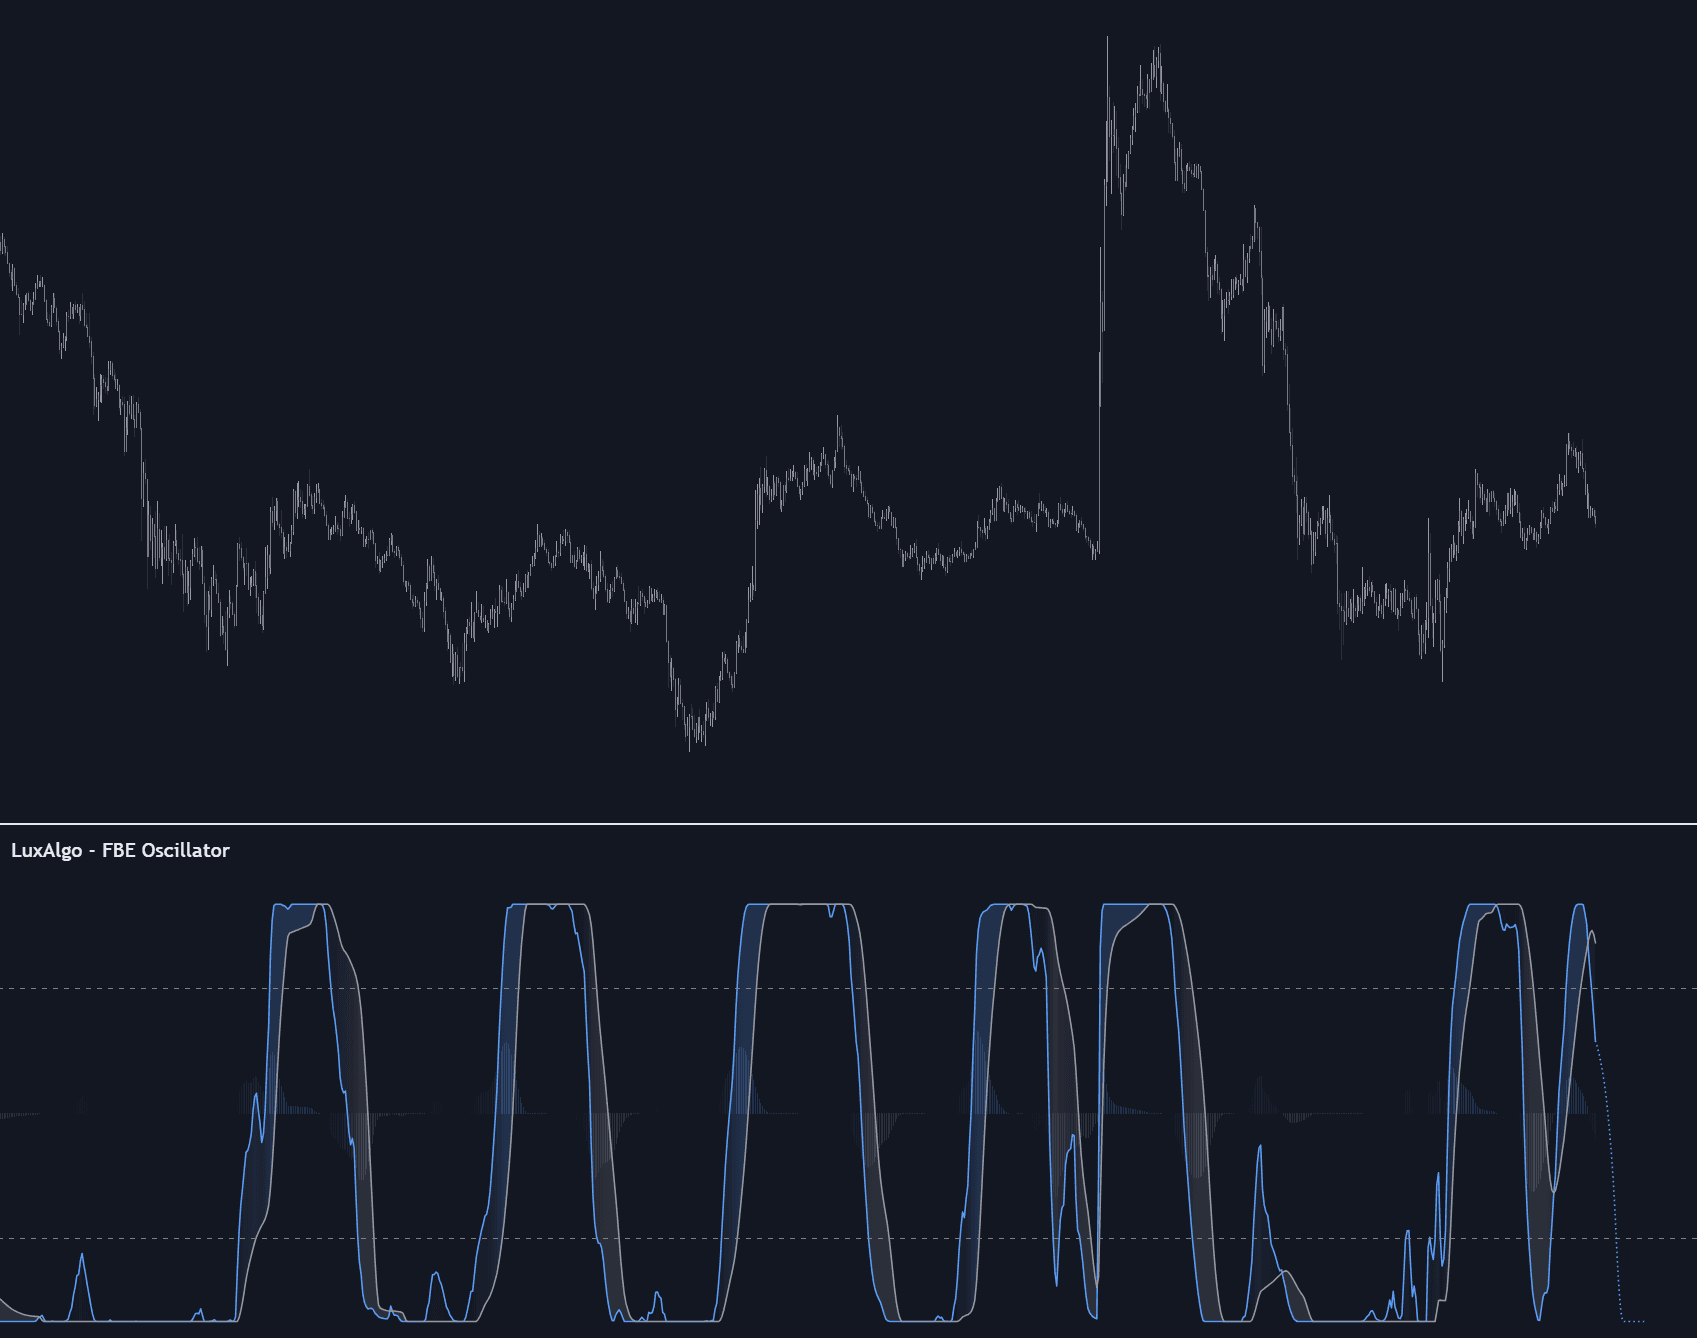
What are Exponential Smoothing Forecasts?
Exponential smoothing forecasts extrapolate a series from exponentially weighted averages of its own past, with recent data counting most. Simple exponential smoothing keeps a single state, the level: each new observation is blended in with a smoothing constant between 0 and 1, the same recursion that defines an EMA, and its forecast is a flat line at the current level. Charles Holt extended the method with a second smoothed component for trend, so the forecast extends as a sloped line (double exponential smoothing), and Peter Winters added a third for seasonality (the Holt-Winters method), letting forecasts carry a repeating seasonal shape.
The family came out of 1950s operations research rather than trading: Robert G. Brown developed simple exponential smoothing for inventory and tracking problems, Holt's trend extension circulated from 1957, and Winters published the seasonal form in 1960. The methods earned their keep in the large forecasting comparisons of later decades, where simple, well-tuned smoothing models proved hard to beat across thousands of ordinary business series, which is precisely their reputation: strong baselines, not crystal balls.
These are extrapolations, not analyses: the model assumes the recent level, trend, and seasonal pattern persist, and it knows nothing about structure, news, or regime change. Responsiveness is a dial rather than a free improvement; higher smoothing constants track turns faster but pass through more noise, and forecast error grows quickly with horizon.
Each component has its own dial: alpha updates the level, beta the trend, gamma the seasonal shape, and a damped-trend variant adds one more parameter that flattens the projected slope as the horizon extends, a widely used guard against straight-line optimism. On charts the models appear both as forecast overlays and as trend-aware smoothers, since a Holt filter tracks a trending series with less lag than a plain average of equal smoothness.
How to read an exponential smoothing forecast on a chart
Forecast overlays project the model's state forward from the current bar; reading one is mostly about knowing which state it carries.
- 1Identify the variant: a flat projection means level-only smoothing, a sloped line means Holt's trend form, and a wiggling projection means a seasonal component is included.
- 2Check the responsiveness settings: high smoothing constants make the projection chase recent bars, low ones make it a slow consensus; neither is right in general.
- 3Read the projection as dead reckoning: it states where price goes if the recent level, trend, and rhythm simply persist.
- 4Use the gap as the signal: price pulling away from the projection flags acceleration or a break in the old pattern, while repeated undershoot flags a stalling trend.
- 5Distrust the far end: uncertainty widens fast with horizon, so the first few projected bars carry most of whatever information the model has.
How traders use it
- To project a dead-reckoning baseline a few bars ahead: price pulling away from the projected line flags acceleration, while repeated undershoot flags a stalling trend.
- To smooth indicator inputs with a trend-aware average: Holt-style smoothing tracks a trending series with less lag than a plain average of the same length, because the trend component compensates.
- To model repeating intraday or weekly patterns with the Holt-Winters seasonal form, the model-based cousin of seasonality tooling.
- To gauge surprise systematically: the forecast residual, standardized as a z-score of recent errors, turns each new bar into a measured surprise, and residuals that stay serially correlated (see autocorrelation) say the model is missing structure.
- As a light-weight benchmark: before trusting a heavier model, comparing it against a tuned smoothing forecast shows whether the extra machinery actually earns its complexity on the series at hand.
Exponential smoothing vs related fitting tools
Linear Regression: Regression fits one line to the whole window, weighting every bar equally and revising the fit as bars enter and leave. Exponential smoothing is recursive and forgetful by design, so it adapts continuously and never re-litigates old data.
Kalman Filter: The Kalman filter is the probabilistic generalization: level and trend become state variables with explicit noise models and uncertainty. Holt-style smoothing is the fixed-gain special case, simpler to tune and cheaper to run, with no uncertainty estimate attached.
Polynomial Regression: Polynomial fits chase curvature inside the window and are notoriously wild at the endpoints, exactly where forecasts live. Smoothing models keep the projection deliberately simple (flat, sloped, or seasonal), which is less expressive and far harder to fool.
Concept family
Statistics
46 concepts mapped · 46 in the Library
Exponential Smoothing Forecasts FAQ
Turn Exponential Smoothing Forecasts into a trading strategy.
Take the implementation from this page into Quant, then build on it, backtest it on real data, and keep refining it in conversation.