Average Daily Range
Average Daily Range, also known as ADR, average day range, daily range, is a Volatility concept. The Library holds 1 implementation, a working definition you can pull into Quant.
Top Average Daily Range indicator
The top custom implementation, built on the original standard Average Daily Range formula.
1 total
This Average Daily Range implementation is strategy-ready: open it in Quant, set your rules, and it backtests automatically.
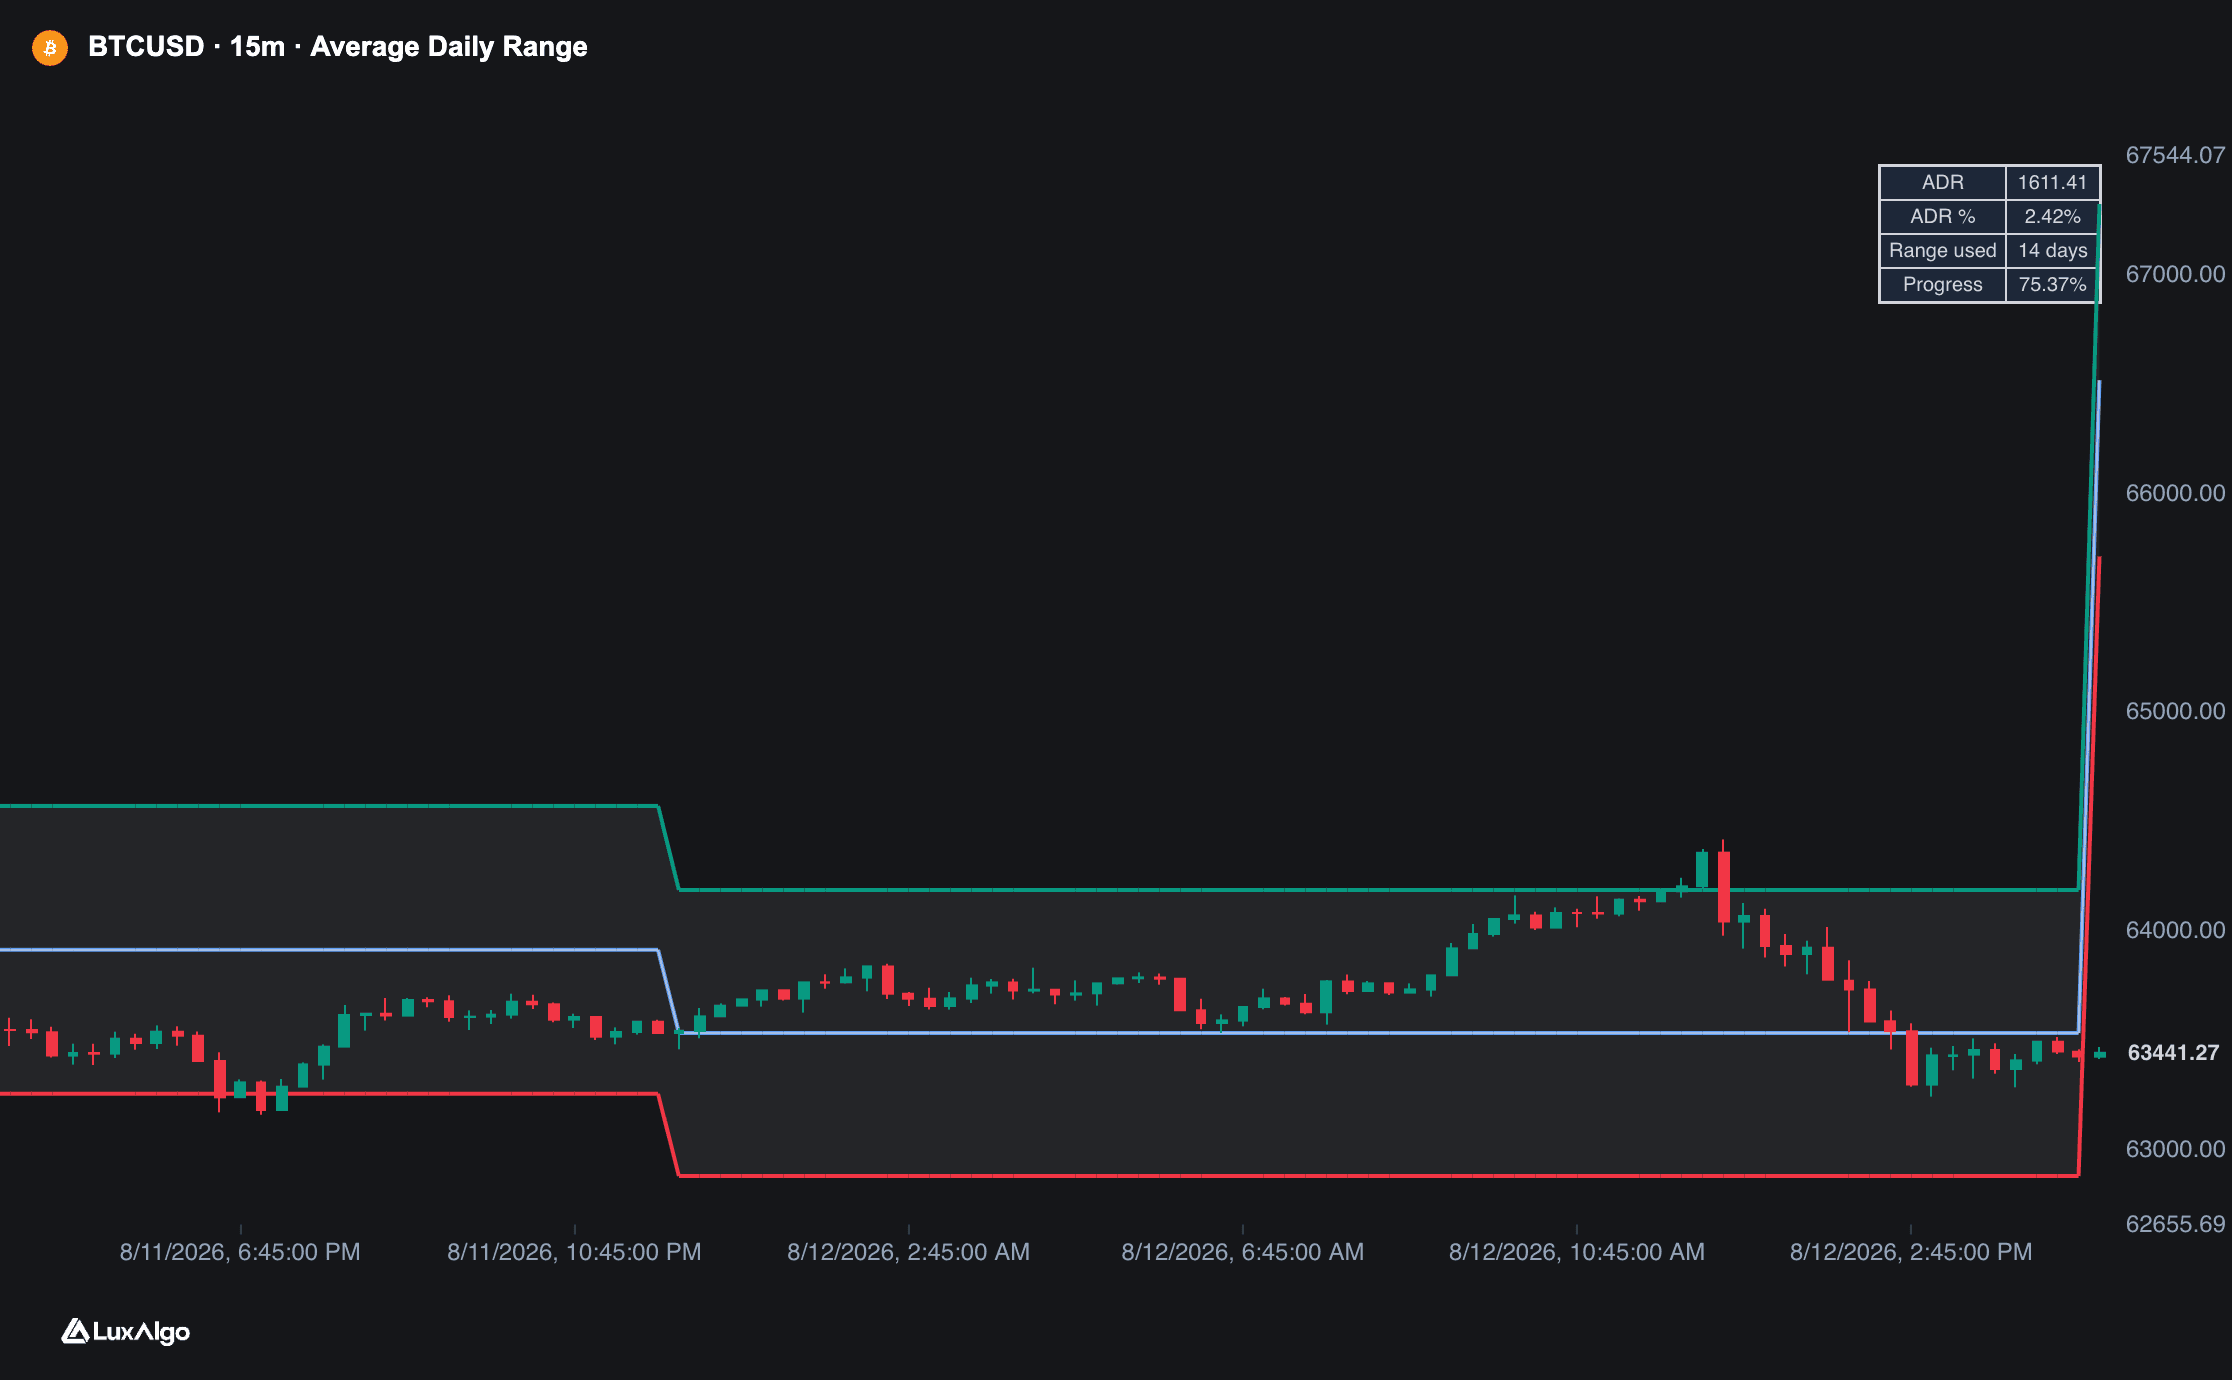
What is the Average Daily Range (ADR)?
The average daily range (ADR) is the mean distance between each day's high and low over a lookback of recent sessions, a direct answer to how far a market usually travels in a day. It is computed from completed daily bars, typically the last 5 to 20, and quoted in price units (points, pips, dollars) or as ADR%, the same average as a percentage of price, which puts a 20-dollar stock and a 2,000-dollar index on one scale.
The construction is deliberately plainer than ATR. Wilder's true range stretches each bar back to the prior close so overnight gaps count, and his smoothing weights the past exponentially; ADR keeps only the high-to-low span and usually a simple average. That makes ADR the purer measure of travel within the session: on a stock that gaps 3 percent and then trades a narrow day, ATR records the gap while ADR records the narrow day. On markets that trade around the clock, such as crypto and most of the forex week, gaps are rare and the two readings converge.
Its main use is projection. Because the average describes a typical day, traders lay it onto the current session as an expected-range map, either symmetrically (half the ADR above and below the open) or from whichever extreme has already printed (today's low plus the ADR as a provisional ceiling, today's high minus the ADR as a provisional floor). LuxAlgo's Average Daily Range indicator works the symmetric way, projecting half of a 14-day ADR above and below the daily open and reporting the day's range so far as a percentage of it.
The honest framing is statistical, not structural. ADR levels are not support or resistance in any order-flow sense; they mark where an average day would have ended, and real days are not average. Trend days can cover two or three times the norm, and volatility clusters, so an average built from quiet weeks understates the first violent day that follows them. ADR is best used as a sense of proportion: whether a target is ordinary or ambitious, and whether a stop sits inside normal daily noise.
How to calculate and project ADR
The average uses completed daily bars; the projection is then drawn on whatever intraday timeframe you trade.
- 1For each of the last n completed days, subtract the low from the high. Common lookbacks are 5, 10, 14 and 20 days: shorter windows track the current regime, longer ones give a steadier baseline.
- 2Average the ranges. A simple mean is the usual choice; exponential or Wilder smoothing also works but prints a different number, so stay consistent.
- 3For ADR%, divide the ADR by price (today's open or the prior close) and multiply by 100. A widely shared screening version instead averages each day's high-to-low ratio, 100 × (average of high ÷ low − 1); the two forms read close to, but not exactly, the same.
- 4Project it onto today: the open plus and minus half the ADR gives a symmetric band; once the session has a low and a high, low plus ADR and high minus ADR give the dynamic version, which tightens as the day develops.
- 5Track completion: today's high minus low, divided by the ADR. Readings past 100 percent mean the day is already wider than average, which describes the day rather than calling a reversal.
How it's calculated
The average high-to-low span of completed daily bars, its percentage form, and the two common ways of projecting it onto the current session.
Only completed days enter the average, so today's projection is fixed at the open and does not drift during the session.
Unlike ATR, the ADR ignores the prior close: overnight gaps do not count toward the range.
The daily bar boundary matters on 24-hour markets (forex commonly rolls at 5 p.m. New York, crypto at midnight UTC on many venues), and a different cutoff produces different ranges.
How traders use it
- As a target sanity check: a day-trade target that needs price to travel 150 percent of the ADR from the open is asking for an unusual session, while one inside the band asks for an ordinary day.
- As a stop-distance floor: a stop placed at a small fraction of the ADR sits inside routine daily travel and tends to be hit by noise, so intraday traders size stops against the ADR much as swing traders size them against ATR.
- As an exhaustion filter: once a session has covered its full ADR, some traders stop chasing and watch the projected extreme for rejection. Trend days run straight through such levels, so the fade is usually conditioned on structure rather than taken at the line.
- As a screen: ADR% ranks a watchlist by how much each name moves; momentum stock traders, with Kristjan Kullamägi (Qullamaggie) the name most associated with it, use it to keep only stocks volatile enough to reward a breakout trade.
- As a regime gauge: a 5-day ADR well below the 20-day reading flags range contraction, the coiled condition that NR4/NR7 bars mark at the single-day scale and that a volatility breakout rule is built to catch as it releases.
Average Daily Range vs related measures
ATR: ATR averages true range, which reaches back to the prior close and so counts gaps, smoothed with Wilder's RMA. ADR averages the plain high-to-low span. ATR is the better stop unit for positions held overnight; ADR is the cleaner measure of travel within the session.
Range Expansion/contraction: Range expansion and contraction is the regime phenomenon, the alternation between narrow and wide bars. ADR is one of its simplest yardsticks: today's range divided by the average is exactly the ratio expansion studies flag.
Pivot Points: Pivot points derive the day's map from yesterday's high, low and close through fixed formulas. ADR projections lay an average of many days' ranges onto today's open or extremes, so they measure typical travel rather than yesterday's specific structure.
Opening Range & ORB: The opening range is measured live from the session's first minutes. The ADR exists before the open and describes the whole day's typical span; traders often check how much of it the opening range has already used.
Concept family
Volatility
61 concepts mapped · 61 in the Library
Average Daily Range FAQ
Turn Average Daily Range into a trading strategy.
Take the implementation from this page into Quant, then build on it, backtest it on real data, and keep refining it in conversation.