Concept
Fractal Nesting
Fractal Nesting is a Market Structure concept. The Library holds 1 implementation, a working definition you can pull into Quant.
structure within structure
Top Fractal Nesting indicator
The top custom implementation, built on the original standard Fractal Nesting formula.
1 total
Want to trade Fractal Nesting? The implementation below is one prompt away from a backtested strategy in Quant.
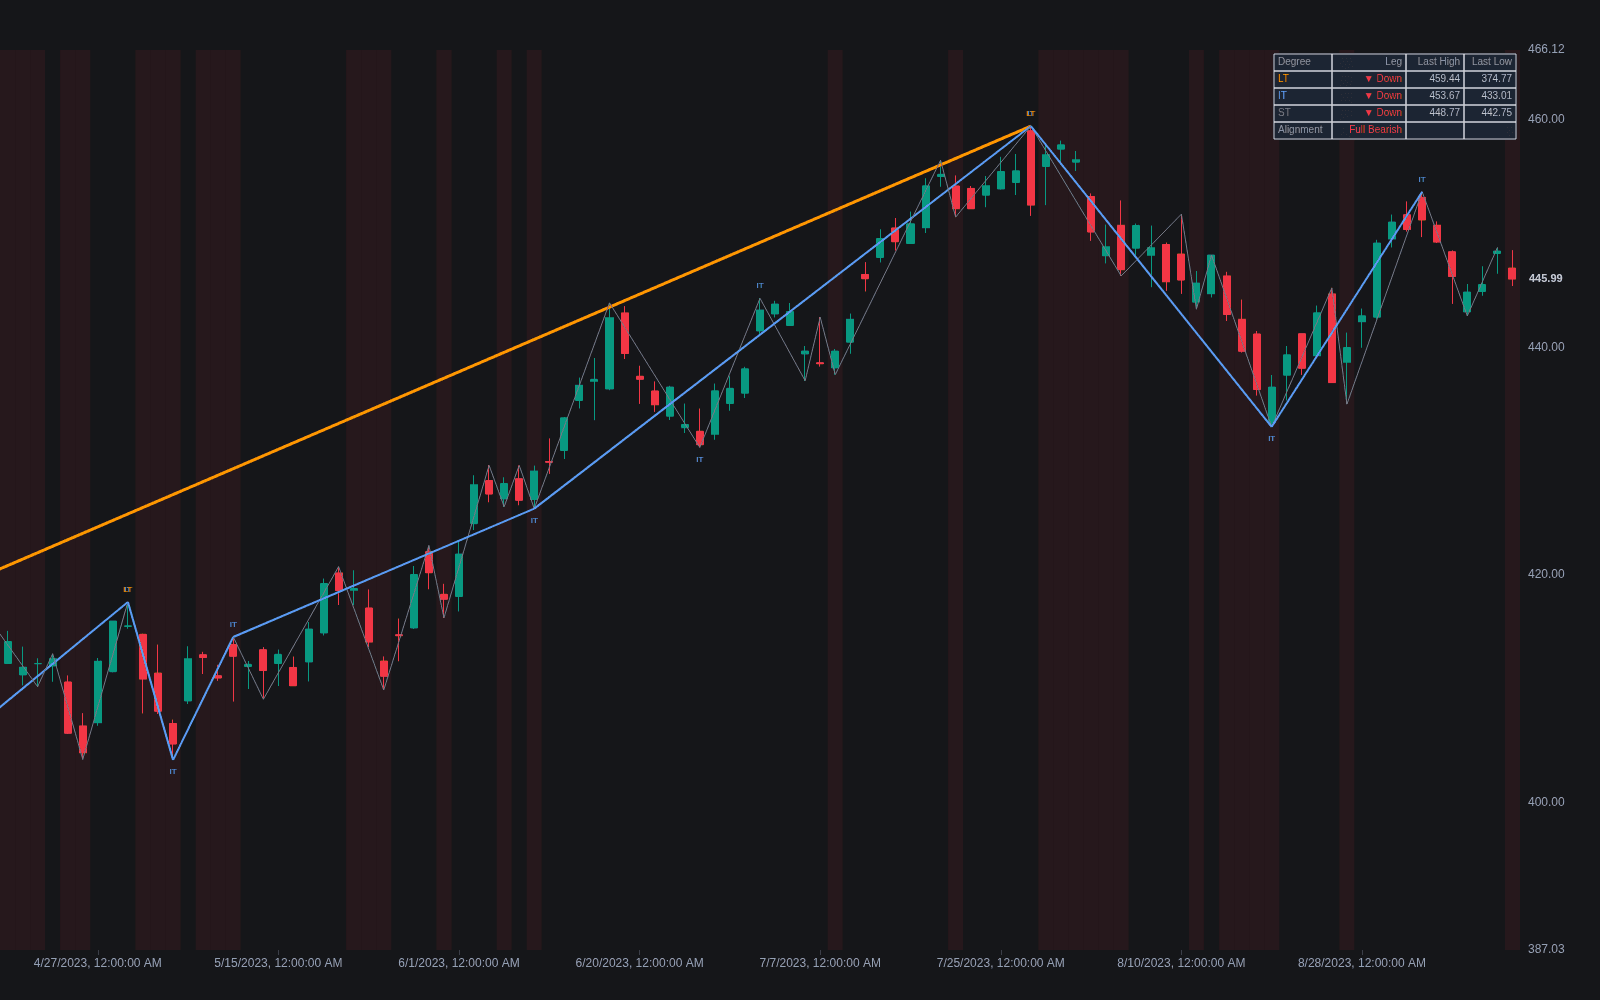
What is Fractal Nesting?
Fractal nesting is the observation that market structure is self-similar across degrees: every swing at one scale is built out of complete smaller swing sequences at the scale below. A daily up-leg decomposes into hourly higher highs and higher lows; each hourly leg decomposes into minute-level structure, and so on. The idea is usually formalized recursively, in the style popularized by Larry Williams: a short-term high is a high with lower highs on either side; an intermediate-term high is a short-term high flanked by lower short-term highs; a long-term high is an intermediate-term high flanked by lower intermediate-term highs. Higher-degree swing highs and lows are therefore defined from lower-degree ones, not computed separately.
The lineage is old. Dow Theory described three interlocking degrees of trend more than a century ago: primary tides, secondary reactions, and minor ripples, each riding inside the next. Ralph Nelson Elliott made self-similarity the core of his wave principle in the 1930s, assigning every swing a degree built from the degrees below it. Benoit Mandelbrot supplied the mathematics, arguing from the 1960s onward that price records look statistically similar across sampling scales and coining the word fractal in 1975. Larry Williams' contribution, published in Long-Term Secrets to Short-Term Trading (1999), was the compact recursive definition structure indicators still implement today.
Mechanically, nesting is containment. Promote a zigzag by one degree and each leg becomes a container: an advancing leg holds a complete lower-degree uptrend with its own breaks of structure, while a higher-degree pullback typically resolves, one level down, into a full downswing or a sideways trading range. Because the definition is recursive, one rule applied repeatedly labels short-, intermediate-, and long-term pivots (the ST/IT/LT tags many structure tools print) from a single chart, without loading extra timeframes.
The practical implication is that any higher-timeframe reversal must begin life as a lower-timeframe structure break, so nested reading surfaces earlier but noisier information; managing that trade-off is the job of multi-timeframe structure alignment. The self-similarity is approximate, not exact: a clean trend at one degree can contain disorderly ranges at the degree below.
How to identify fractal nesting on a chart
Nesting is easiest to see by building degrees upward from raw pivots, by hand or with a recursive structure indicator.
- 1Mark the raw swing pivots: every high with lower highs on both sides, every low with higher lows on both sides. These are the short-term, first-degree pivots.
- 2Build the second degree from the first: a short-term high flanked by lower short-term highs is an intermediate-term high; invert for intermediate-term lows.
- 3Repeat for long-term pivots, labeling each pivot with its degree so one chart carries all three maps.
- 4Check containment: each higher-degree leg should enclose a complete lower-degree sequence, such as an up-leg holding lower-degree higher highs and higher lows.
- 5Watch where degrees disagree, a lower-degree downtrend inside a higher-degree up-leg; that is where pullbacks end or reversals begin.
How traders use it
- To build pivot hierarchies: a single recursive definition labels short-, intermediate-, and long-term highs and lows from one price series, giving a structure map at several degrees on a single chart.
- To time higher-timeframe ideas: since a higher-degree turn has to start as a lower-degree break, traders holding a higher-timeframe bias watch nested lower-degree structure, such as a change of character, inside their zones for earlier entries, accepting more false starts in exchange.
- To keep swing labels honest: assigning each swing a degree prevents category errors, such as reading a minor pullback's break as if the major trend had changed.
- To grade breakouts by degree: a break of a long-term pivot carries different weight than a break of a short-term one; demanding the right degree screens out breaches of merely minor structure, a common source of false breakouts.
- To stage invalidation: the nearest lower-degree pivot invalidates the entry idea while the higher-degree pivot invalidates the whole thesis, giving a tiered stop and exit plan.
Fractal nesting vs related structure concepts
Williams Fractal: A Williams Fractal is a fixed five-bar pivot pattern: a local high with two lower highs on each side, or the inverse for lows. It marks a single pivot at a single scale, while fractal nesting stacks such pivots into higher degrees; the five-bar pattern often serves as the recursion's base unit.
Swing Structure Grammar: Swing structure grammar names the events a sequence of pivots produces (higher highs, breaks, shifts) at one degree. Nesting is the vertical dimension: the claim that the same grammar repeats at every degree, each composed of the one below.
Multi-timeframe Structure Alignment: Alignment compares structure read independently on separate timeframe charts; nesting derives all degrees from one series with one recursive rule. The two usually agree in direction, but nested degrees share exact pivot locations, while resampling can shift where pivots appear.
Concept family
Market Structure
31 concepts mapped · 31 in the Library
Fractal Nesting FAQ
Turn Fractal Nesting into a trading strategy.
Take the implementation from this page into Quant, then build on it, backtest it on real data, and keep refining it in conversation.