Concept
1-2-3 Reversal
1-2-3 Reversal, also known as Ross hook continuation, is a Market Structure concept. The Library holds 1 implementation, a working definition you can pull into Quant.
Top 1-2-3 Reversal indicator
The top custom implementation, built on the original standard 1-2-3 Reversal formula.
1 total
From studying 1-2-3 Reversal to trading it: take the implementation below into Quant and backtest it instantly.
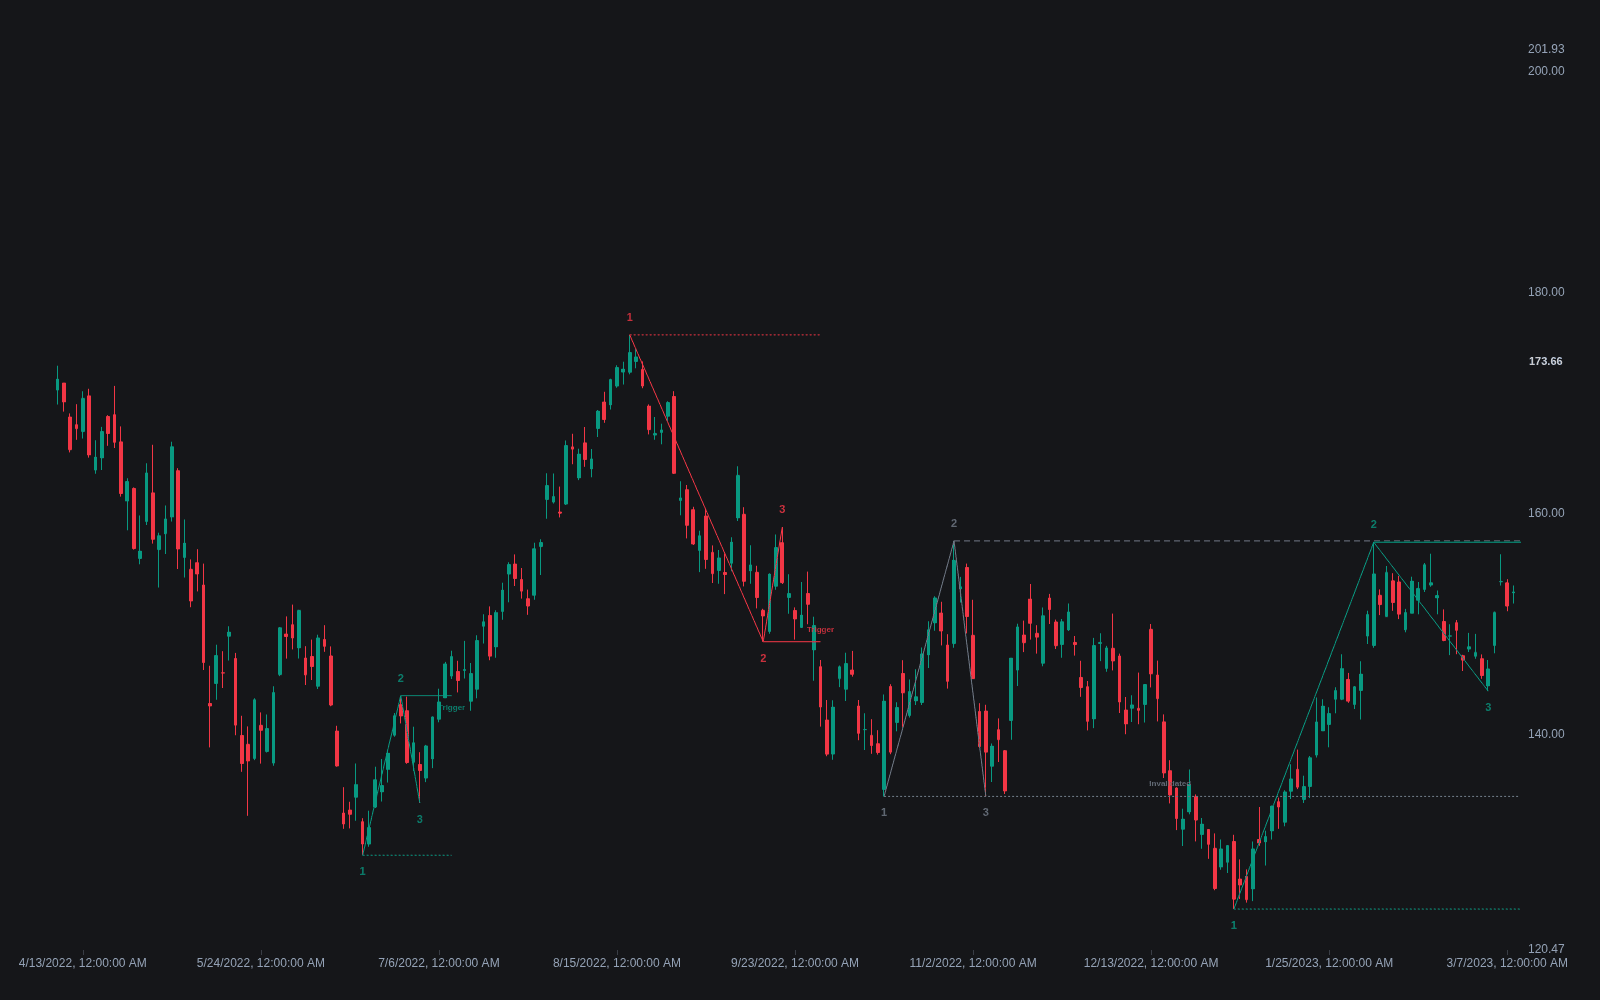
What is a 1-2-3 Reversal?
A 1-2-3 reversal is a three-point trend-change pattern. In the bullish case, point 1 is the final low of the decline, point 2 is the swing high of the first rally off that low, and point 3 is a pullback low that holds above point 1. The pattern completes when price breaks above point 2, printing the first higher high after the first higher low. The bearish version mirrors this at tops. The trigger matters: until point 2 actually breaks, the pattern is only a candidate.
The setup was popularized in modern form by Victor Sperandeo, whose 1-2-3 rule in Trader Vic: Methods of a Wall Street Master (1991) paired the pattern with a trendline break, and by Joe Ross, whose books from the same era treated the 1-2-3 formation as the characteristic start of new trends. Ross added the follow-on continuation entry: after completion, the first pullback in the young trend forms a Ross hook, and the break of the hook's extreme confirms the move, hence the alias Ross hook continuation.
Neither author invented the underlying logic. The 1-2-3 restates Dow Theory's trend test in miniature: an uptrend is a series of higher highs and higher lows, so its earliest possible evidence is a single higher low (point 3) followed by a single higher high (the break of point 2). Structurally it is the smallest complete definition of a trend change, which is why Smart Money Concepts traders recognize its completion as a change of character, the first break of structure against the prevailing trend: different vocabulary, same pivots.
The pattern's value is less prediction than bookkeeping. It turns the vague question of whether the trend has changed into three checkable facts: a terminal extreme, a countertrend impulse leg, and a corrective leg that fails to reach the old extreme. Each point also defines risk: point 1 is where the reversal idea is simply wrong, and point 2 is the objective trigger.
How to identify a 1-2-3 reversal on a chart
The pattern only means something after a trend worth reversing, so confirm there is one first.
- 1Fix a consistent pivot rule, such as a Williams fractal or an N-bar swing, so the three points are defined objectively rather than by eye.
- 2Mark point 1 at the extreme of the existing trend: for a bullish reversal, the lowest low of the decline.
- 3Mark point 2 at the pivot ending the first rally off that low; an impulsive first leg carries more weight than a drift.
- 4Mark point 3 where the pullback bottoms; it must hold above point 1, or the pattern is void and the count resets.
- 5Treat the pattern as complete only on a break of point 2; many traders require a close beyond it rather than a wick to filter a false breakout of the trigger level.
How traders use it
- As a mechanical trend-change trigger: entry on the break of point 2, with the initial stop beyond point 1 (full invalidation) or beyond point 3 for tighter risk at the cost of more noise stop-outs.
- As the seed of a continuation campaign: once the 1-2-3 completes, the first pullback in the new trend (the Ross hook) offers a second entry for traders who missed or distrusted the reversal itself.
- As a discipline filter: countertrend ideas stay untradeable until a 1-2-3 actually completes, which keeps traders from shorting strength or buying weakness on hope alone.
- With higher-timeframe context: a 1-2-3 completing at a meaningful higher-timeframe level, or agreeing with multi-timeframe structure alignment, outranks one printed in the middle of nowhere.
- With range awareness: inside a trading range, rotations print 1-2-3s in both directions constantly, so range-bound charts demote the pattern to noise until price nears an edge.
1-2-3 reversal vs adjacent structure concepts
Change of Character: Change of character names the event, the first structural break against the prevailing trend. The 1-2-3 numbering names the pivots that produce it and pins the trigger to the break of point 2.
Break of Structure: A break of structure is any break of a structural pivot, including with-trend breaks that continue a move. The 1-2-3 is the specific three-pivot sequence in which the first countertrend break occurs.
Swing Failure Pattern: A swing failure pattern is a fast liquidity event, a wick through an extreme that immediately fails. A 1-2-3 is a slower structural sequence; the two meet when point 1 itself forms via a swing failure at the old extreme.
Concept family
Market Structure
31 concepts mapped · 31 in the Library
1-2-3 Reversal FAQ
Turn 1-2-3 Reversal into a trading strategy.
Take the implementation from this page into Quant, then build on it, backtest it on real data, and keep refining it in conversation.