Concept
Parabolic Phase
Parabolic Phase is a Market Structure concept. The Library holds 1 implementation, a working definition you can pull into Quant.
Top Parabolic Phase indicator
The top custom implementation, built on the original standard Parabolic Phase formula.
1 total
From studying Parabolic Phase to trading it: take the implementation below into Quant and backtest it instantly.
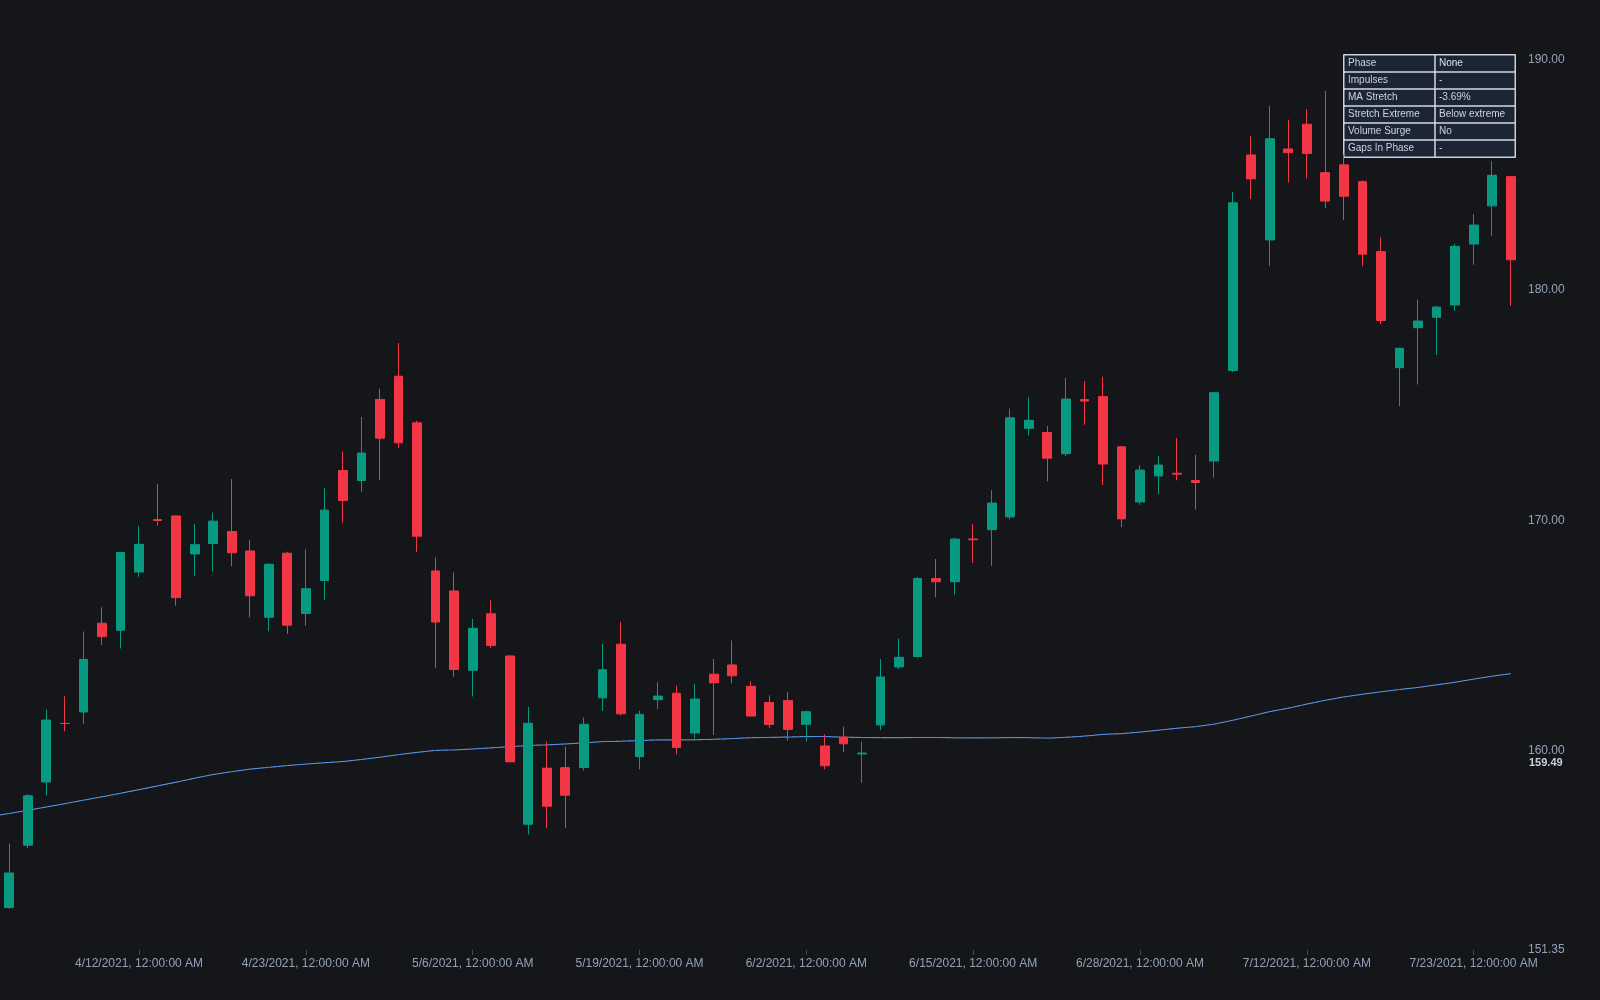
What is a parabolic phase?
A parabolic phase is the terminal stage of a strong trend in which price stops advancing linearly and begins to curve: each successive leg is steeper and faster than the last, pullbacks shrink or vanish, and the chart's slope bends toward vertical. The name comes from the shape, price traces something like a parabola on the chart. Parabolic phases appear at the end of major uptrends most famously, but capitulation declines produce the inverted version.
The phase exists because of feedback. Late in a trend, performance chasing, short covering, forced liquidation, and fear of missing out all push in the same direction, so buying begets buying. That feedback is also why the phase is unsustainable: the steepening requires accelerating inflows, and when they falter even briefly there is no nearby structure to catch price. Parabolic advances therefore tend to end abruptly, often with a climactic move and a V-shaped reversal rather than a gentle rounding, and the retracements that follow are frequently deep.
Traders care for two opposite reasons. The phase contains some of the fastest profits available anywhere, and it destroys latecomers and premature short sellers alike. Recognizing that a market has entered its parabolic stage changes the job: the question is no longer whether the trend is healthy but how to harvest it and when to stop pressing, which connects the concept to the broader study of trend exhaustion and the late markup phase of a trend's life.
How to identify a parabolic phase
The signature is acceleration you can measure with trendlines and leg comparisons.
- 1Draw successive trendlines under the advance: a parabolic move forces repeated redraws at steeper angles, each holding for less time than the last.
- 2Compare legs: each impulse covers more price in fewer bars than the prior one, while pullbacks become shallower and shorter until dips are bought intraday.
- 3Watch the distance from long-term moving averages stretch to historical extremes for that instrument.
- 4Look for supporting symptoms: surging volume, runaway gaps in gapping markets, and saturation of the story in mainstream coverage.
- 5Treat the first decisive break of the steepest trendline, or the first pullback deeper than any seen during the acceleration, as evidence the phase has ended.
How traders use it
- For trailing rather than predicting: experienced trend riders tighten stops progressively under each steeper trendline or recent swing low, accepting that the top will be given up only after it forms.
- As a prohibition on new entries: initiating fresh longs deep into a parabolic phase carries poor location by construction, since the nearest support is far below.
- As a short-selling caution: parabolas routinely extend far beyond any reasonable target, so fading the move on steepness alone has ruinous tail risk; most practitioners wait for the acceleration trendline to break first.
- For expectation setting after the break: once a parabolic advance fails, retracements of half or more of the advance are common historically, so "buying the dip" frameworks calibrated to normal trends tend to underestimate the downside.
- As a regime label in Wyckoff-style analysis, where the phase often corresponds to a buying climax ending the markup stage; see climactic action for the volume-side signature.
Parabolic phase vs. related concepts
Climactic moves: A climactic move is the final burst itself, often one to a handful of bars on extreme volume. The parabolic phase is the extended acceleration regime that typically precedes and contains such a climax.
Bump-and-run reversal: The bump-and-run is a specific chart pattern that formalizes the same behavior: a lead-in trend, an accelerating bump, and the break of the lead-in trendline. A parabolic phase is the general condition; the BARR is one codified way to trade its failure.
Parabolic SAR: Despite the shared word, Parabolic SAR is Wilder's trailing stop-and-reverse indicator whose dots accelerate toward price. It is a tool, not a market phase, though its accelerating design makes it a popular trailing method during parabolic advances.
Trend exhaustion: Trend exhaustion is the broad study of trends running out of participation. A parabolic phase is a specific exhaustion route where the trend ends through acceleration and collapse rather than gradual rollover.
Concept family
Market Structure
31 concepts mapped · 31 in the Library
Parabolic Phase FAQ
Turn Parabolic Phase into a trading strategy.
Take the implementation from this page into Quant, then build on it, backtest it on real data, and keep refining it in conversation.