Concept
Internal vs External Structure
Internal vs External Structure is a Market Structure concept. The Library holds 1 implementation, a working definition you can pull into Quant.
Top Internal vs External Structure indicator
The top custom implementation, built on the original standard Internal vs External Structure formula.
1 total
This Internal vs External Structure implementation is strategy-ready: open it in Quant, set your rules, and it backtests automatically.
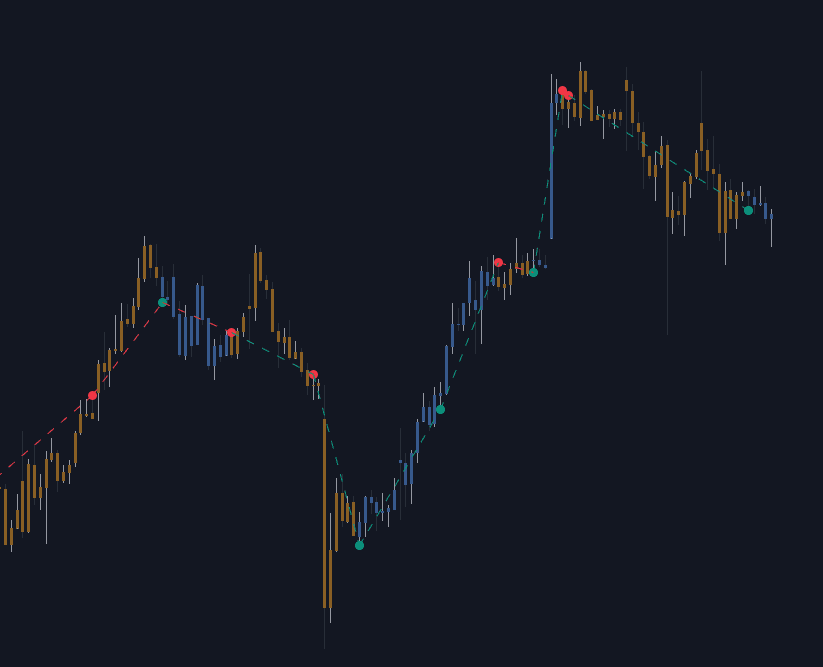
What is Internal vs External Structure?
External structure is the market's major swing skeleton: the significant swing highs and lows that define the current trend or range at the degree being analyzed. Internal structure is everything printed inside one external leg: the smaller swings price makes while traveling between major points. The split is hierarchical rather than tied to fixed timeframes; zoom into any external leg and its internal swings have internal structure of their own, which is fractal nesting applied to labeling.
The idea predates its current vocabulary. Dow Theory split movement into primary trends, secondary reactions, and minor fluctuations over a century ago, and Elliott's wave degrees carried the same nesting further. Modern swing structure grammar restates it mechanically: define swings by rule, then rank them by degree. Smart Money Concepts popularized the internal/external wording itself, which is why the pair is now standard in structure indicators even though the observation is old.
The distinction matters because structure signals mean different things at different degrees. An internal break of structure or change of character is early, frequent, and noisy evidence that the current leg may be turning; an external break is later but confirms that the higher-degree trend itself has shifted. Common Smart Money Concepts practice reads external structure for bias and internal structure for timing, while accepting that most internal shifts resolve as ordinary pullbacks rather than reversals.
On a chart the split is usually operationalized with two swing-detection settings. A wide pivot length or zigzag traces the external skeleton, while a tight setting, sometimes as small as a five-bar Williams fractal, captures the internal swings inside each impulse and corrective leg; structure indicators typically plot both with different label weights. The labels are parameter-dependent: lengthen the pivot setting and yesterday's external swing demotes to internal. That is less a flaw than a reminder that degree is a chosen lens, which is why analysts fix settings and reference range before reading anything.
How to identify internal vs external structure
The labels are relative, so the reference frame comes first and the classification follows.
- 1Choose the reference: fix the timeframe and the trend leg or trading range being analyzed. External only exists relative to this choice.
- 2Mark external swings: the major pivots defining that range or trend, typically found with a wide pivot or zigzag setting, including the current range high and low.
- 3Label internal swings: the smaller highs and lows printed between external points, using a tighter swing setting on the same chart.
- 4Classify each break: a close beyond an external point is an external break of structure or change of character; breaking any swing between them is an internal event of lower rank.
- 5Re-anchor after external breaks: redraw the range and relabel, since former internal swings often become the new external skeleton.
How traders use it
- To separate bias from trigger: external structure sets the directional bias, and an internal shift in that direction (an internal change of character inside a pullback, for example) supplies the earlier, lower-degree trigger used to time the entry.
- To filter signals: an internal break against the external bias is treated as a pullback event, not a reversal, until external swing points also give way.
- To place invalidation sensibly: stops are commonly set beyond the external swing that defines the idea, because internal levels are swept too routinely to protect a position.
- To align timeframes from one chart: internal structure at one degree is external at the degree below, so multi-timeframe structure alignment can be read by tracking both label sets instead of flipping between charts.
- To anticipate range resolution: repeated internal swing failures pressing one side of a range hint at which external extreme is under attack, the behavioral read formalized in accumulation vs distribution ranges.
Internal vs External Structure vs related concepts
Break of Structure: A break of structure is a single event; internal vs external is the grading system applied to it. The same close through a prior high is a routine timing cue when the high is internal and a trend statement when it is external; the label decides the event's weight.
False Breakout: A false breakout is what an external break looks like when it fails: price closes beyond a major swing, cannot hold, and returns into the range. The lens matters because internal breaks fail constantly and prove little, while a failed external break is significant information.
Concept family
Market Structure
31 concepts mapped · 31 in the Library
Internal vs External Structure FAQ
Turn Internal vs External Structure into a trading strategy.
Take the implementation from this page into Quant, then build on it, backtest it on real data, and keep refining it in conversation.