Concept
Multi-timeframe Structure Alignment
Multi-timeframe Structure Alignment is a Market Structure concept. The Library holds 2 implementations, each one a working definition you can pull into Quant.
Top Multi-timeframe Structure Alignment indicators
The top custom implementations, built on the original standard Multi-timeframe Structure Alignment formula.
2 total
Any of the 2 Multi-timeframe Structure Alignment implementations below can become a backtested trading strategy — describe your rules and Quant writes the code.
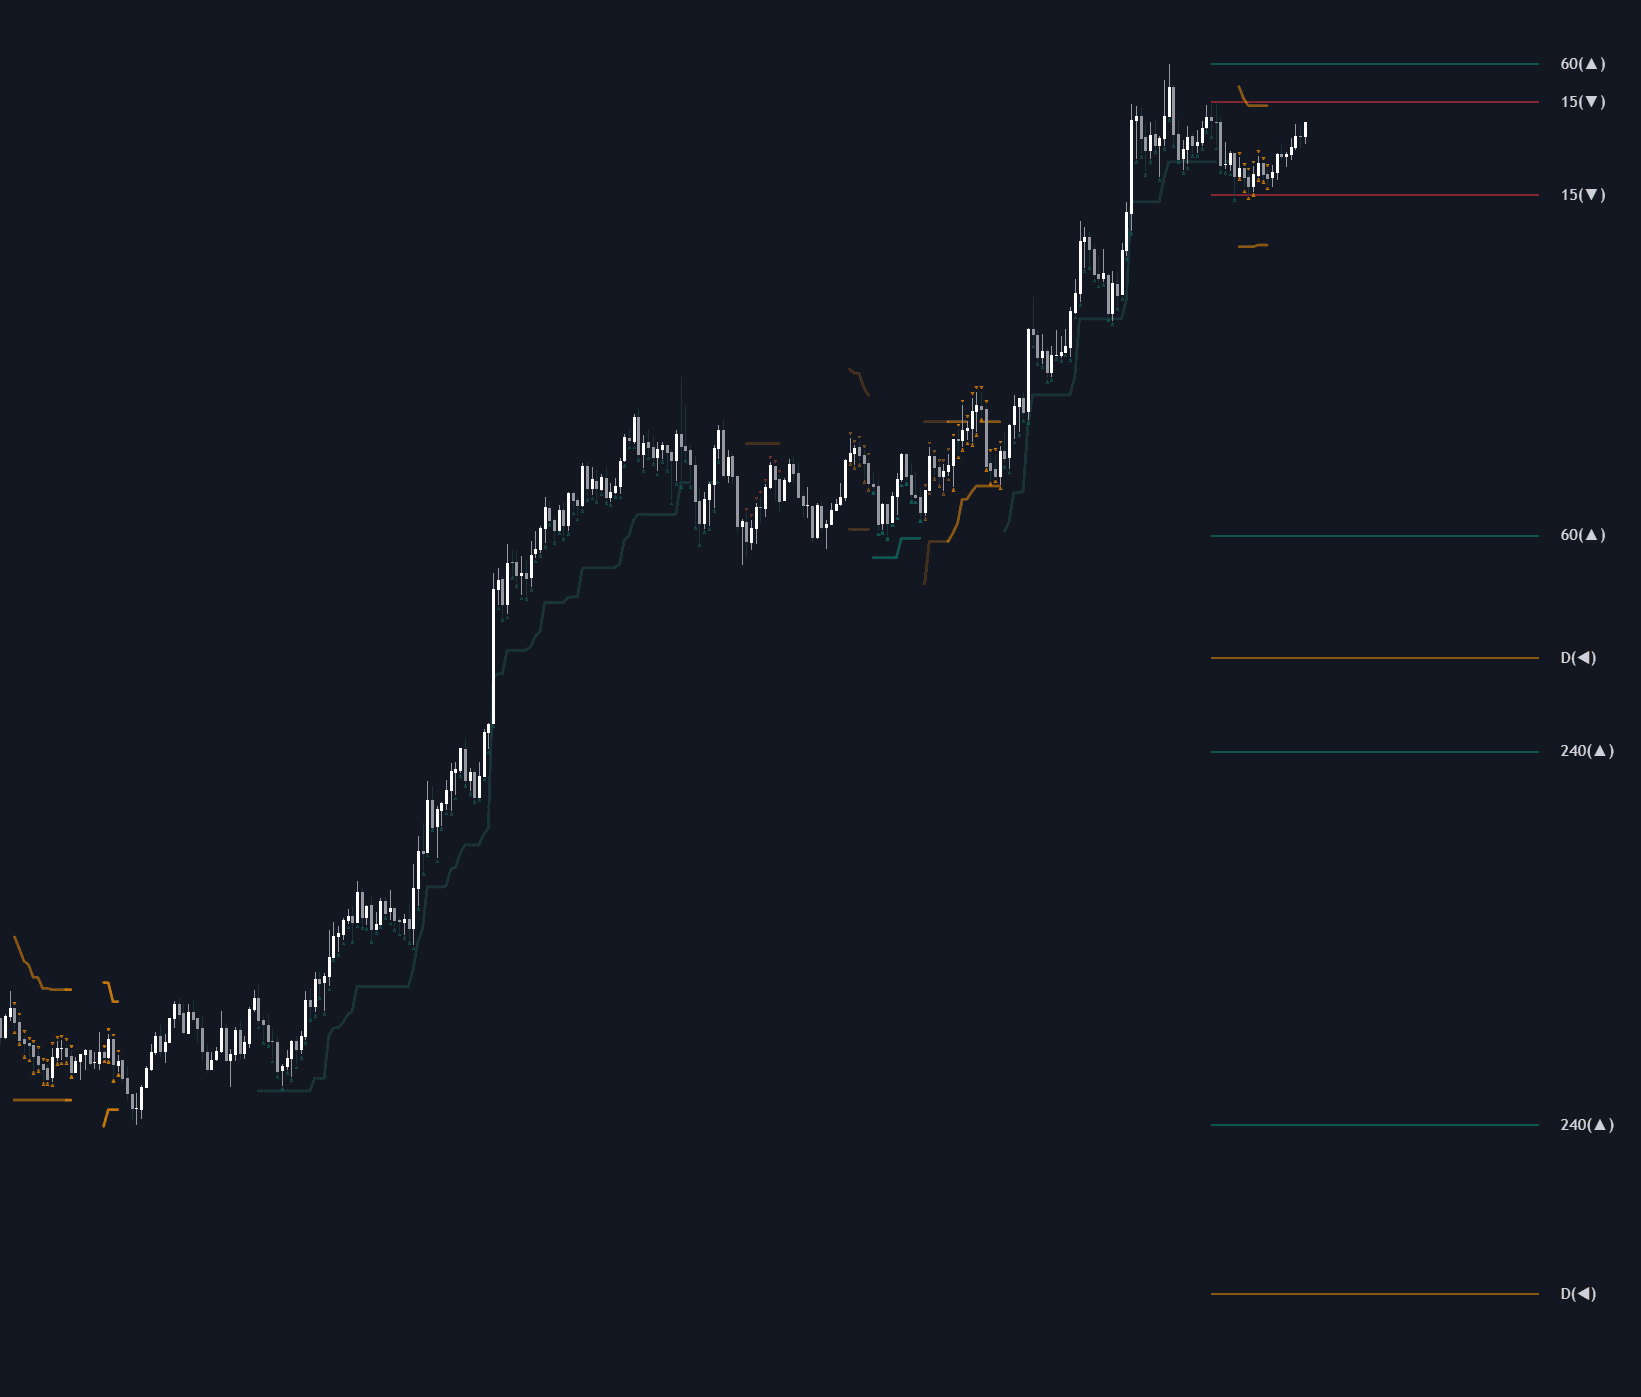
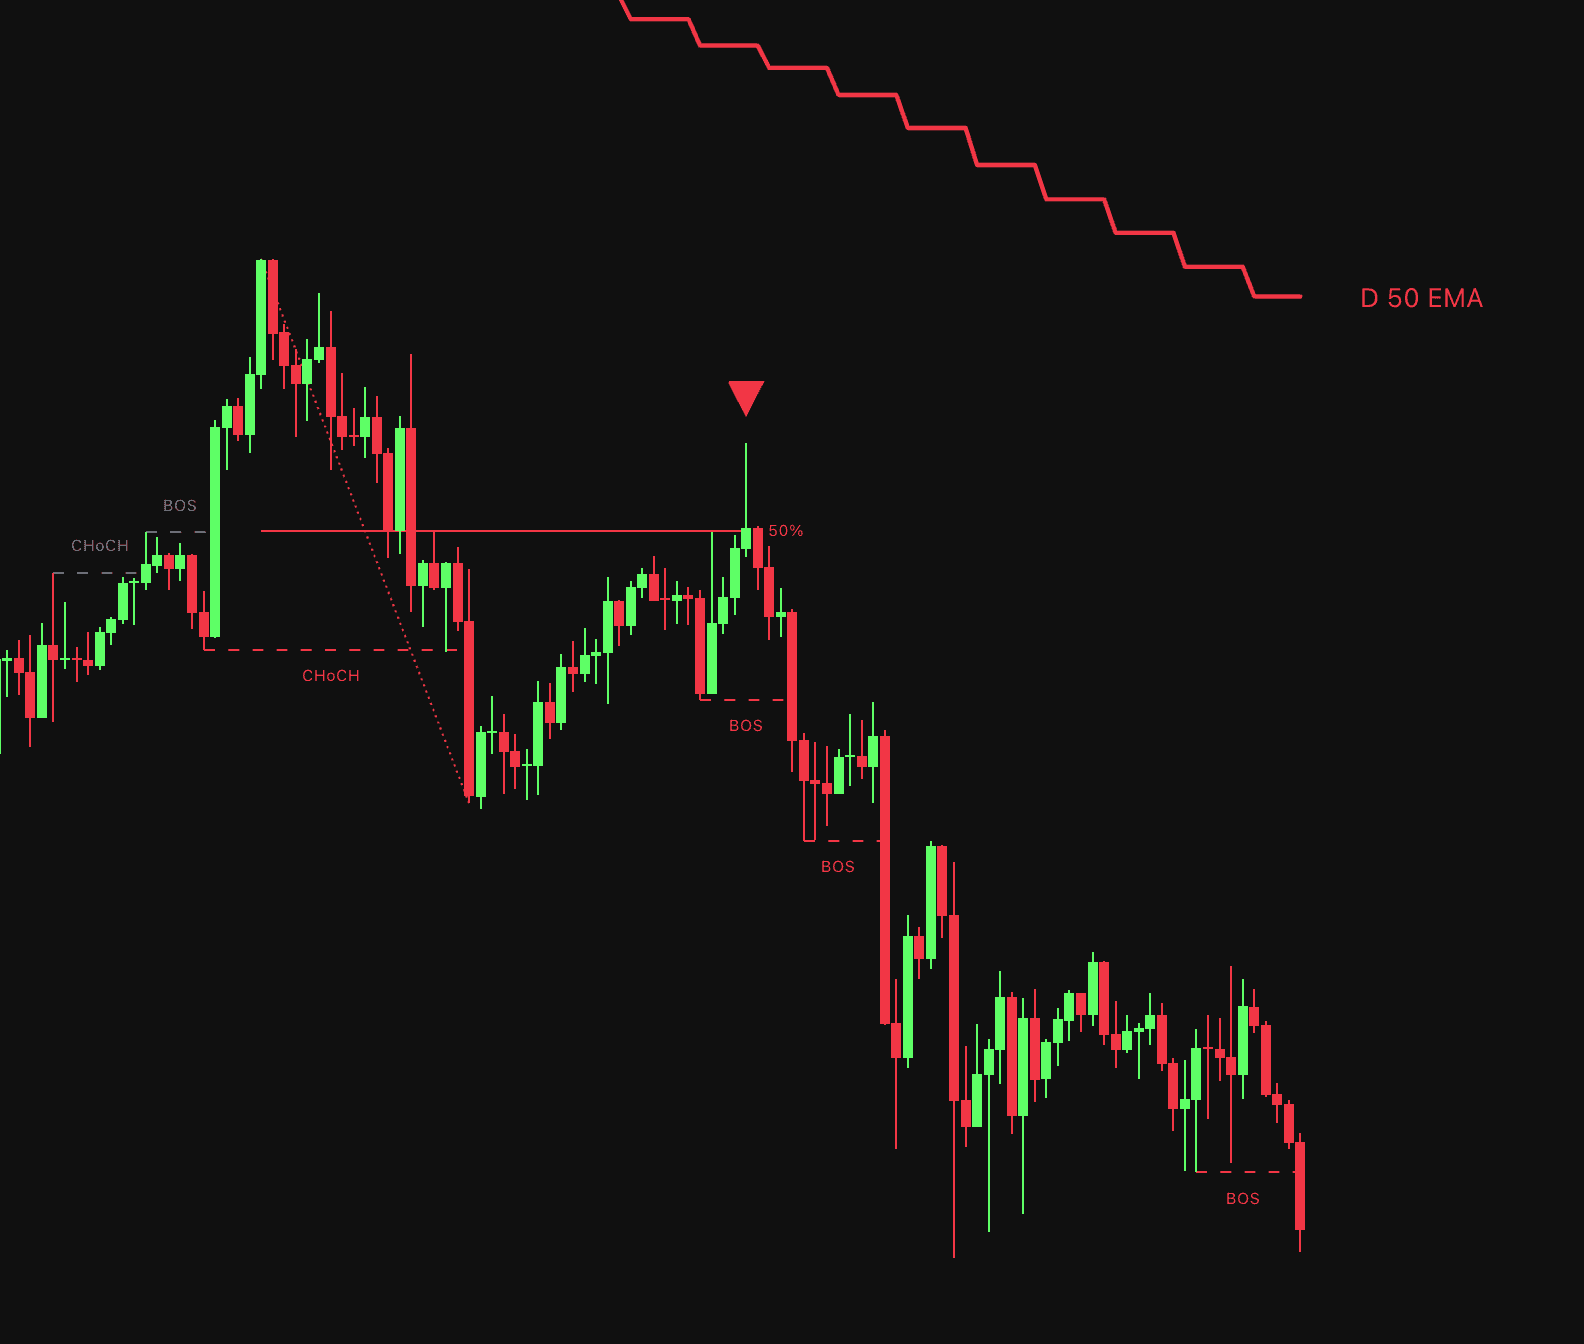
What is Multi-timeframe Structure Alignment?
Multi-timeframe structure alignment is the practice of requiring the swing structure of two or more timeframes to agree before acting. Each timeframe has its own swings, trends, and breaks, because market structure is nested: a full downtrend on the 15-minute chart is often nothing more than a pullback inside a 4-hour uptrend. Alignment asks a simple question of that nesting: is the leg you want to trade on the entry timeframe pointing the same way as the leg that contains it?
The standard workflow is top-down: establish bias from higher-timeframe structure (the sequence of swing highs and lows and the most recent break of structure), then drop to a lower timeframe and wait for its structure to turn the same way before entering. It matters because it addresses a common source of conflicting signals: many losing counter-trend entries are lower-timeframe trends that were never more than corrections on the chart above. The cost is fewer trades and added lag, and alignment is a filter, not a guarantee; timeframes can stay in disagreement for long stretches, which usually just means the higher timeframe is in a corrective phase.
How to read multi-timeframe structure alignment
Alignment is a comparison, so the read is only as good as the independent structure calls it is built from.
- 1Choose a timeframe pair or triplet with a meaningful step between them; a factor of roughly four to six, the convention Elder's triple screen popularized, keeps each chart genuinely distinct.
- 2Label structure on each timeframe independently: the recent swing highs and lows, whether they form higher highs and higher lows or the reverse, and the most recent structural break. Do not let one chart's labels contaminate the other.
- 3Compare the states: aligned when both point the same way; conflicted when the lower timeframe runs against the higher, which most often marks a higher-timeframe correction in progress.
- 4Act by your model: trade lower-timeframe signals only in the shared direction, or, in the conflicted state, wait for the lower timeframe's change of character back in the higher-timeframe direction, commonly at a higher-timeframe level.
How traders use it
- As a directional filter: only lower-timeframe setups whose direction matches higher-timeframe structure are taken. It is the structural cousin of a higher-timeframe trend filter, using swings and breaks instead of a moving average.
- As an entry-timing sequence: higher-timeframe bias plus a lower-timeframe structure shift at a higher-timeframe level is a standard top-down execution model in Smart Money methods and classical swing trading alike.
- As protection against counter-trend traps: a lower-timeframe break against the higher-timeframe trend is treated as internal, corrective movement until the higher timeframe's own structure actually breaks.
- As a scored input: automated systems count how many timeframes agree and gate or weight signals by that tally, the approach formalized in MTF alignment and confluence scoring.
Multi-timeframe Structure Alignment vs related concepts
Higher-timeframe Trend Filter: The trend filter gates entries with a higher-timeframe indicator state, such as price above a long moving average. Structure alignment does the same job with swing structure itself: no indicator, just agreement between the swing sequences and breaks on each chart.
Fractal Nesting: Fractal nesting is the descriptive fact: swings contain smaller swings at every scale. Multi-timeframe structure alignment is the actionable rule built on top of that fact, requiring the nested layers to point the same way before a trade is taken.
Internal vs External Structure: The single-chart version of the same idea: internal structure is effectively lower-timeframe structure viewed inside one higher-timeframe leg. Marking internal versus external structure on one chart and flipping between two timeframes amount to largely the same analysis.
Concept family
Market Structure
31 concepts mapped · 31 in the Library
Multi-timeframe Structure Alignment FAQ
Turn Multi-timeframe Structure Alignment into a trading strategy.
Take any implementation from this page into Quant, then build on it, backtest it on real data, and keep refining it in conversation.