Concept
Zigzag Structure
Zigzag Structure, also known as wave proxy parameterization, Gann swing charts, is a Market Structure concept. The Library holds 9 implementations, each one a working definition you can pull into Quant.
Top Zigzag Structure indicators
The top custom implementations, built on the original standard Zigzag Structure formula.
9 total
Want to trade Zigzag Structure? Any of the 9 implementations below is one prompt away from a backtested strategy in Quant.
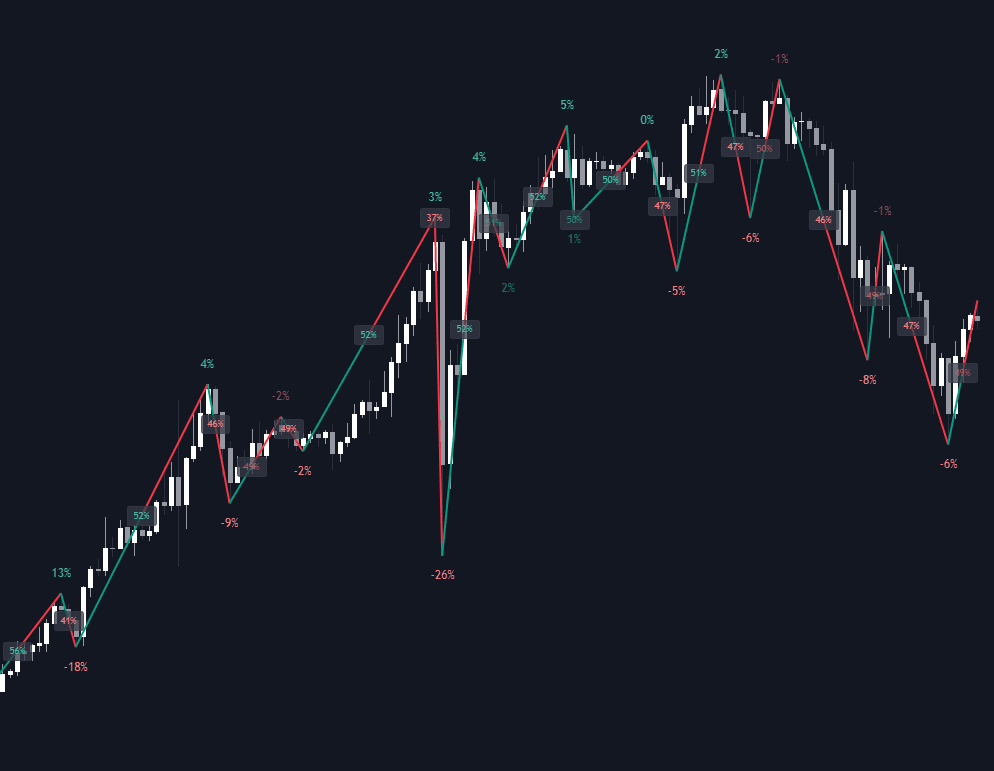
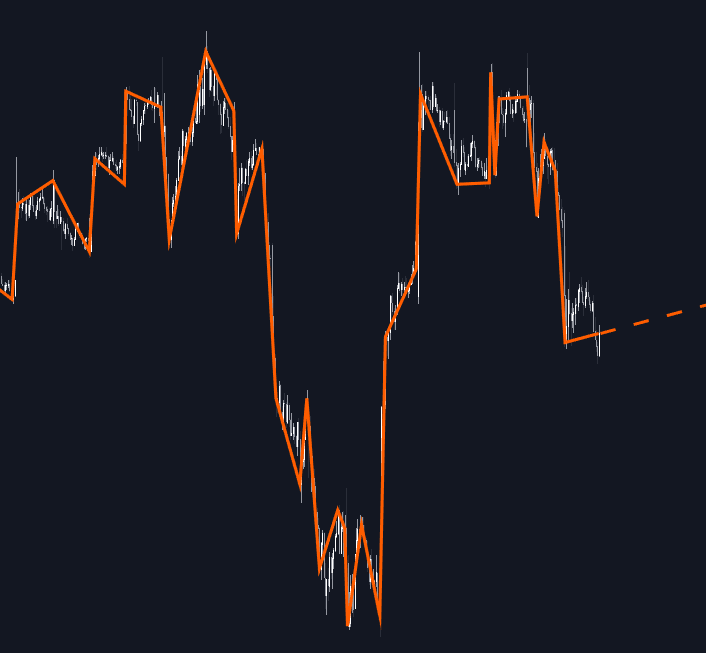
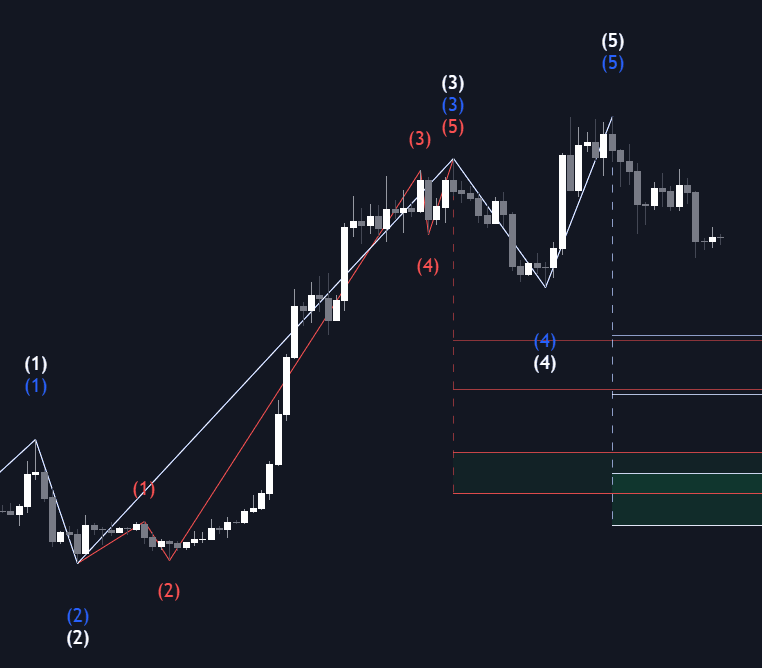
The standard Zigzag Structure indicator
Zigzag Structure exactly as classically defined: the faithful reference build of the original formula, free to run in Quant.
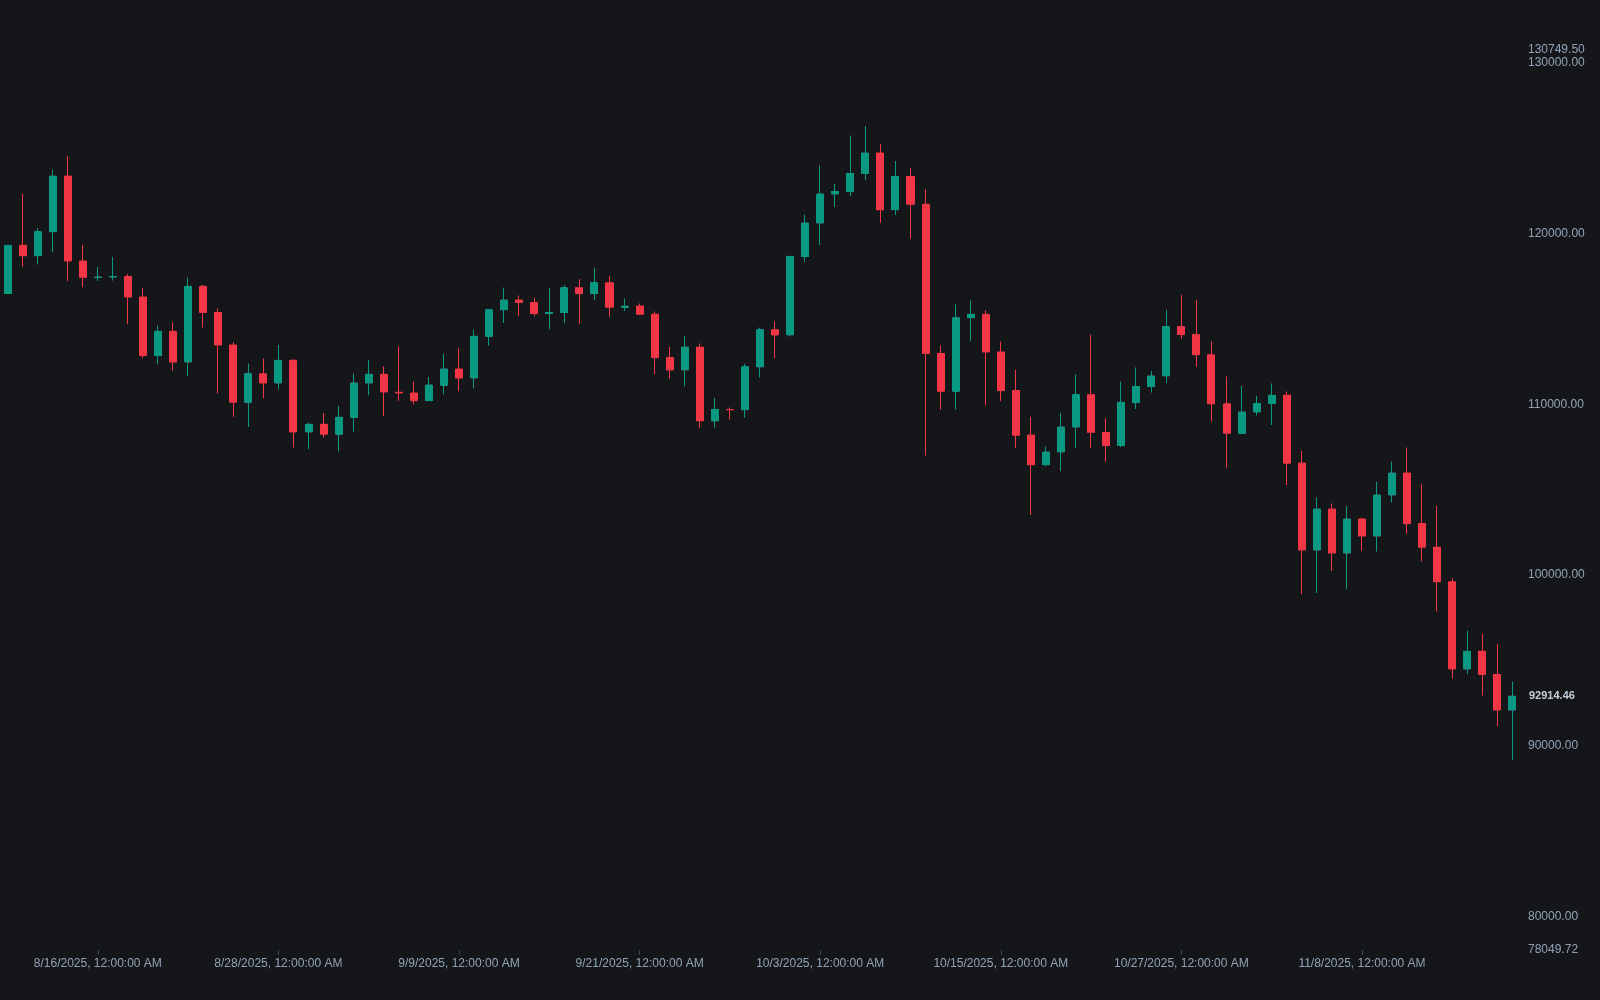
What is Zigzag Structure?
A zigzag reduces price action to a sequence of alternating up and down legs. The rule is a reversal threshold: while an up leg is running, the algorithm tracks the highest high, and only when price retreats from that extreme by more than the threshold (a percentage, a fixed amount, or an ATR multiple) does it confirm the high as a pivot and begin a down leg. Every move smaller than the threshold is discarded as noise.
The connected pivots are swing highs and lows, so a zigzag is best understood as a swing detector plus a magnitude filter, a close relative of Gann's swing charts, which applied the same idea with bar-count rules. It is rarely a signal by itself. Its job is data reduction: once price is simplified into legs, downstream logic can label higher highs and lower lows through a swing structure grammar, count waves, measure retracement ratios, or match patterns on the reduced series. The threshold sets the scale: small values expose minor swings, large values keep only major ones.
It matters because nearly every structural tool needs an answer to "what counts as a swing," and the zigzag is the most common answer. Its defining limitation is that the newest leg is provisional by construction: a pivot only confirms after price has already reversed by the full threshold, so the final segment can extend, move, or vanish as new bars arrive. Confirmed pivots are stable; anything built on the live leg inherits that lag.
How to calculate a zigzag
The zigzag is fully mechanical, so the clearest way to understand it is to walk the algorithm.
- 1Choose a reversal rule: a percentage of price, a fixed point amount, an ATR multiple, or a bar-count pivot (a high with N lower highs on each side). Percentage and ATR rules adapt across price levels and volatility regimes; fixed points do not.
- 2Track the running extreme of the current leg. In an up leg, record the highest high since the last confirmed low; in a down leg, record the lowest low since the last confirmed high.
- 3Confirm a pivot when price reverses from that extreme by more than the threshold, then start the opposite leg from the confirmed pivot. Enforce alternation: one high, then one low, never two pivots of the same kind in a row.
- 4Read the output as legs: compare pivot levels to label structure, measure each leg's length and duration, and treat the final, unconfirmed leg as provisional until the next reversal locks it in.
How it's calculated
A polyline connecting alternating swing highs and lows, keeping only reversals larger than a chosen threshold.
Platform parameter sets differ (TradingView uses deviation percent plus pivot depth, MetaTrader uses Depth, Deviation, Backstep) but all implement this extreme-plus-threshold recipe.
Gann swing charts replace the size filter with a bar count: the swing turns up after a set count of consecutive higher highs and down after the same count of consecutive lower lows (commonly 2 or 3).
Confirmed pivots never move, but the newest leg repaints until its reversal confirms, so zigzag describes past structure rather than signaling in real time.
How traders use it
- As the swing engine underneath structure logic: break of structure and change-of-character labels are typically computed by comparing zigzag pivots rather than raw bars, so the zigzag's threshold quietly decides what "structure" means on the chart.
- As a wave proxy: Elliott-style counts and harmonic measurements need discrete legs to work with, so zigzag pivots are the usual anchors for Fib retracement and extension ratios between swings.
- As pre-processing for pattern recognition: detecting double tops, head and shoulders, or triangles is far more tractable on a polyline of a few pivots than on raw candles, which is how many algorithmic pattern scanners are built.
- As a multi-scale lens: running several thresholds at once separates minor structure from major structure, the same idea formalized by swing magnitude filters and nested swing analysis across timeframes.
Zigzag Structure vs related concepts
Swing High/low: A swing high or low is the individual pivot event. The zigzag is the pipeline built on top: it detects pivots, filters them by magnitude, enforces alternation, and connects them into legs. Any pivot definition can feed a zigzag.
Williams Fractal: A fractal confirms a pivot from a fixed five-bar shape regardless of the move's size, so fractals can cluster and print consecutive same-side pivots. A zigzag filters by move size and forces strict high-low alternation.
Renko: Both suppress moves below a threshold, but Renko rebuilds price into fixed-size bricks and abandons the time axis, while a zigzag preserves the true extreme prices and timestamps of each swing on the original chart.
Corrective Wave: In Elliott vocabulary a "zigzag" is a specific 5-3-5 corrective pattern. Zigzag structure in the indicator sense is the generic swing-simplification tool wave analysts draw their counts on; the shared name describes the shape, not the same concept.
More Zigzag Structure implementations
Concept family
Market Structure
31 concepts mapped · 31 in the Library
Zigzag Structure FAQ
Turn Zigzag Structure into a trading strategy.
Take any implementation from this page into Quant, then build on it, backtest it on real data, and keep refining it in conversation.