Concept
ATR-based Stop Distance
ATR-based Stop Distance is a Volatility concept. The Library holds 1 implementation, a working definition you can pull into Quant.
Top ATR-based Stop Distance indicator
The top custom implementation, built on the original standard ATR-based Stop Distance formula.
1 total
The ATR-based Stop Distance implementation below can become a backtested trading strategy — describe your rules and Quant writes the code.
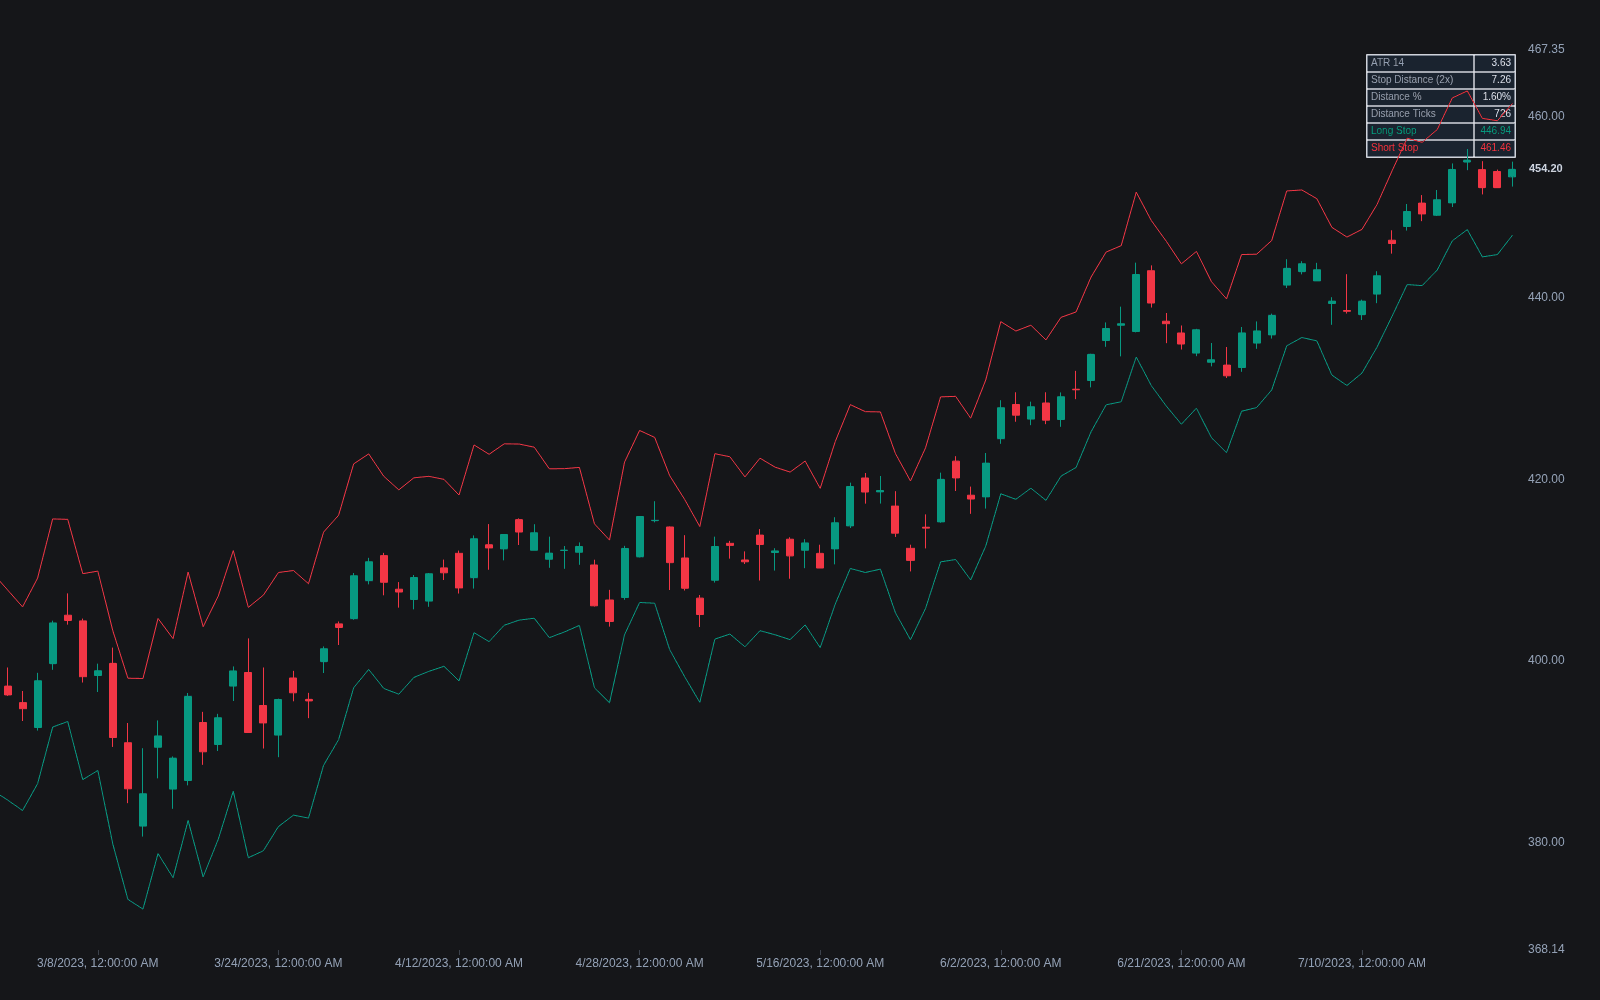
What is ATR-based Stop Distance?
ATR-based stop distance is the practice of placing a stop-loss a multiple of the ATR away from the entry price, below for longs and above for shorts. Wilder's Average True Range measures how far a bar typically travels once gaps are accounted for, so a stop at, say, two ATRs sits beyond the market's typical single-bar travel rather than inside it. The distance self-adjusts: quiet instruments and quiet regimes produce tight stops, volatile ones produce wide stops, and the same multiple transfers across markets because ATR carries each instrument's price units.
The measuring stick has a specific pedigree. J. Welles Wilder introduced ATR in New Concepts in Technical Trading Systems (1978), defining true range as the largest of the bar's high-to-low span and the two gap-inclusive spans from the prior close, then smoothing it (14 periods in his original work). He built it for commodity charts full of limit moves and opening gaps, which is exactly why it suits stop placement: it prices in the jumpiness that a simple high-minus-low range misses.
The mechanism matters because many premature stop-outs are noise hits: exits triggered by routine fluctuation rather than by the trade idea failing. Scaling the stop to measured volatility puts the exit where ordinary wiggle is unlikely to reach it, and it links directly to sizing, since risk per unit equals the stop distance. The honest caveats: a stop is a trigger, not a guaranteed fill, gaps can jump straight through it, and no multiple eliminates the trade-off between being shaken out early and giving back too much.
The same arithmetic underlies a family of tools. Wrap the multiple around price or an average continuously and you get ATR bands and Keltner Channels; ratchet it behind the best price since entry and you get the chandelier and other volatility trails. Stop distance is the raw, single-use form: one measurement, taken at or after entry, that turns current volatility into a concrete exit level and a position size.
How to set an ATR-based stop on a chart
The workflow runs from measurement to multiple to level, and the sizing follows from the same number.
- 1Add ATR to the entry timeframe (14 periods with Wilder smoothing is the standard default) and read the current value in price units.
- 2Choose the multiple by trade style: published practice mostly falls between about 1.5 for short-term trades and 3 for trend-following, to be validated on your own market.
- 3Compute the level: entry minus multiple times ATR for longs, entry plus it for shorts; alternatively anchor beyond a structural point such as a swing low and add an ATR fraction as buffer.
- 4Sanity-check the placement against the chart: the level should sit beyond obvious noise and ideally beyond the structure that would prove the idea wrong.
- 5Derive size from the distance under fixed-fractional rules, so the account risks the same fraction whether the stop is tight or wide.
- 6Decide up front whether the stop stays frozen or trails; if it trails, it should only ever tighten.
How it's calculated
The stop offset expressed as a multiple of Average True Range, so the stop sits farther away when volatility is high and closer when it is low.
Wilder smoothing is the standard ATR; some platforms compute ATR with an EMA or SMA of TR instead.
The Chandelier Exit variant anchors to the highest high (long) or lowest low (short) since entry rather than the entry price.
Position sizing often inverts the formula: position size = risk per trade / StopDistance.
How traders use it
- Initial placement: set the stop a fixed multiple of ATR from entry, or anchor it beyond a structural invalidation such as a swing low and add an ATR fraction as buffer, blending the statistical and structure-based approaches.
- Trailing: ratchet the stop to a multiple of ATR below the highest high (or highest close) since entry so it only ever tightens, the logic behind the chandelier stop and many volatility trails.
- Position sizing: under fixed-fractional risk, size equals the account risk budget divided by the ATR stop distance, so wider stops automatically mean smaller positions instead of bigger losses.
- Cross-market consistency: because the distance is denominated in each instrument's own volatility, one rule set can govern stops on an index future, a forex pair, and a crypto pair without per-market tuning.
- Regime awareness: checking current ATR against its own recent history, via a volatility percentile or a range expansion read, prevents setting multiples from an unusually quiet window that is about to normalize wider.
ATR-based Stop Distance vs. related exits
Fixed Stops: A fixed point or percentage stop ignores current volatility, so it is noise-bait in wild regimes and needlessly wide in quiet ones. The ATR version re-derives the distance from recent data every time.
ATR Bands: ATR Bands plot continuous envelope lines at ATR multiples around price or an average, a charting overlay. Stop distance is a single number measured from your entry; the bands visualize the same arithmetic without being an order level.
Volatility Stop: A volatility stop is a complete indicator: a trailing line that flips with trend, usually ATR-based under the hood. ATR-based stop distance is the raw recipe that such indicators, and manual traders, build from.
Keltner Channels: Keltner Channels wrap an EMA with ATR-multiple bands as a continuous overlay for reading trend and stretch. The stop distance applies the same ATR arithmetic once, from your own entry, to produce an order level rather than a chart envelope.
Concept family
Volatility
57 concepts mapped · 57 in the Library
ATR-based Stop Distance FAQ
Turn ATR-based Stop Distance into a trading strategy.
Take the implementation from this page into Quant, then build on it, backtest it on real data, and keep refining it in conversation.