Concept
Fib Projection
Fib Projection, also known as expansion, is a Support/Resistance & Levels concept. The Library holds 1 implementation, a working definition you can pull into Quant.
Top Fib Projection indicator
The top custom implementation, built on the original standard Fib Projection formula.
1 total
This Fib Projection implementation is strategy-ready: open it in Quant, set your rules, and it backtests automatically.
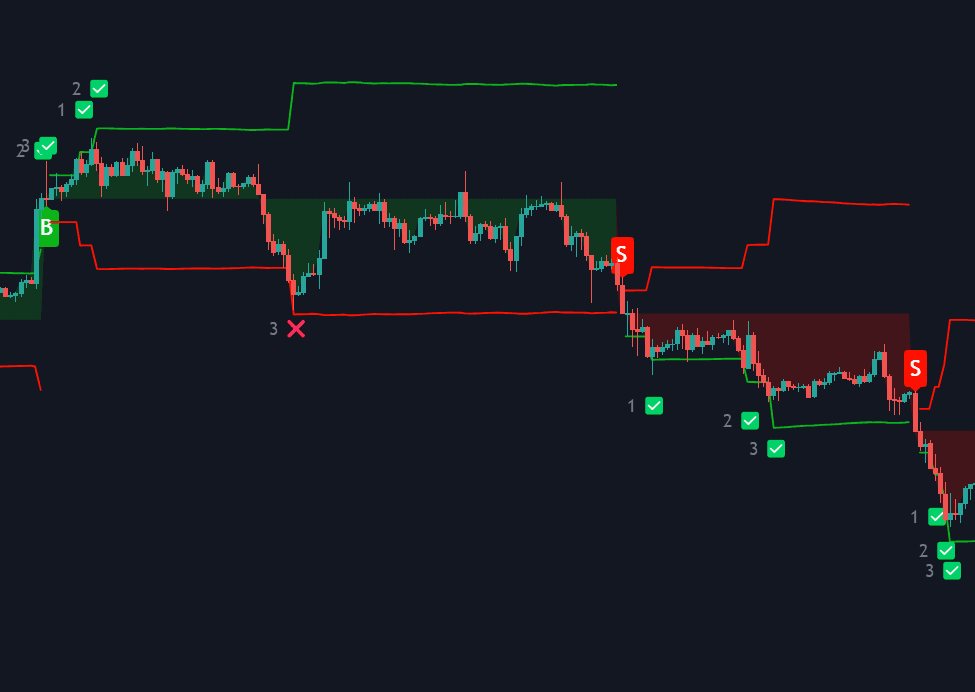
What is a Fib Projection?
A Fib projection is a three-point Fibonacci tool: it measures one completed swing, then plots ratios of that swing's length from a different starting point. Take an advance from A to B and a pullback to C, and the tool projects levels at 0.618, 1.0, 1.272, and 1.618 of the A-to-B distance measured from C. The 1.0 level is the measured move, the same equality logic behind the ABCD pattern: the second leg travels as far as the first.
The tool descends from two traditions at once: the measured-move rule of classical charting, which projected a flag's pole from the breakout long before ratios were attached, and the Elliott and Fibonacci practice that generalized equality into a ratio family (DiNapoli's teaching used the expansion vocabulary for the same three-point construction). Platforms merged the lineages into today's tool, which is why its names remain unsettled while its arithmetic is universal.
Naming is inconsistent across platforms and books. Some call this tool a trend-based Fib extension, reserving extension for the two-point version that stretches ratios of a single swing beyond its own end; others use projection and expansion interchangeably. What matters is the anchor logic: a projection transfers a prior swing's size onto a new base, so always check which points a level was drawn from before trading it.
Anchor craft carries the tool. The measured swing should be a clean, significant leg with unambiguous endpoints, and the C anchor belongs at the pullback's genuine terminus, which often means waiting for that pullback to prove itself first. Projections drawn from minor wiggles produce a lattice of meaningless targets, and re-anchoring until a level flatters the position is the standard self-deception. Like every measured level, a projection is strongest where independent references agree with it and weakest floating alone.
How to draw a Fib projection
The bullish continuation case is described; invert the anchors for declines.
- 1Identify the completed impulse: a clean swing from A (origin) to B (extreme) worth transferring forward.
- 2Anchor C at the end of the pullback that followed, once that pullback has plausibly terminated.
- 3Plot the ratio levels from C: 0.618, 1.0 (the measured move), 1.272, and 1.618 of the A-to-B distance are the standard set.
- 4Treat the levels as management shelves: places to scale, trail, or watch for stalls, rather than reversal predictions.
- 5Upgrade levels with confluence: a projection landing on a prior period level, a retracement from a larger swing, or a tested S/R zone outranks any lone ratio.
- 6Re-draw only when structure changes: a deeper pullback that replaces C invalidates the old projection rather than coexisting with it.
How it's calculated
Targets for a new swing, found by measuring a prior swing's height from the end of the intervening correction at Fibonacci multiples.
Also called Fibonacci expansion (MetaTrader) or trend based Fib extension (TradingView), so check which anchors a platform's tool expects.
With p = 1.0 the projection is the classic measured move, often written AB = CD.
How traders use it
- As profit targets for continuation trades: after entering on the pullback at C, traders scale out where the new leg reaches 0.618, 1.0, or 1.618 of the prior swing, since those are shelves other participants commonly watch.
- For wave targets: Elliott practitioners project wave 1's length from the wave 2 low to estimate wave 3, and wave A from the B point to estimate wave C, following common Fib wave relationships such as equality and 1.618.
- As confluence: a projection level that overlaps a prior high, a retracement from a larger swing, or another draw's target marks a stronger zone than any single measurement.
- In automated confluence maps: projection levels feed level-clustering toolkits alongside retracements and pivots, where overlapping targets from different swings earn the scores that lone levels do not.
- With the time axis attached: pairing a price projection with Fib time tools frames when the measured objective might arrive as well as where, a two-axis version of the same transfer logic.
Fib Projection vs related Fibonacci tools
Fib Retracement: The retracement measures within a swing, grading pullback depth between its endpoints. The projection transfers a swing's length onto a new base to set targets beyond it: one tool asks how deep, the other how far.
Fib Geometry Tools: The geometry family (fans, arcs, channels) applies ratios to slope and curvature. Projections stay purely vertical, transferring price distance alone, which keeps them the family's most testable and least discretionary member after the retracement.
Fibonacci Pivots: Fibonacci pivots put ratios through a fixed formula on the prior period's range, identical for all users. Projections are drawn from chosen swings, so they respond to structure and carry anchor discretion the formula version deliberately removes.
Concept family
Support/Resistance & Levels
38 concepts mapped · 38 in the Library
Fib Projection FAQ
Turn Fib Projection into a trading strategy.
Take the implementation from this page into Quant, then build on it, backtest it on real data, and keep refining it in conversation.