Concept
Measured-move Up/down
Measured-move Up/down is a Chart & Candlestick Patterns concept. The Library holds 1 implementation, a working definition you can pull into Quant.
Top Measured-move Up/down indicator
The top custom implementation, built on the original standard Measured-move Up/down formula.
1 total
From studying Measured-move Up/down to trading it: take the implementation below into Quant and backtest it instantly.
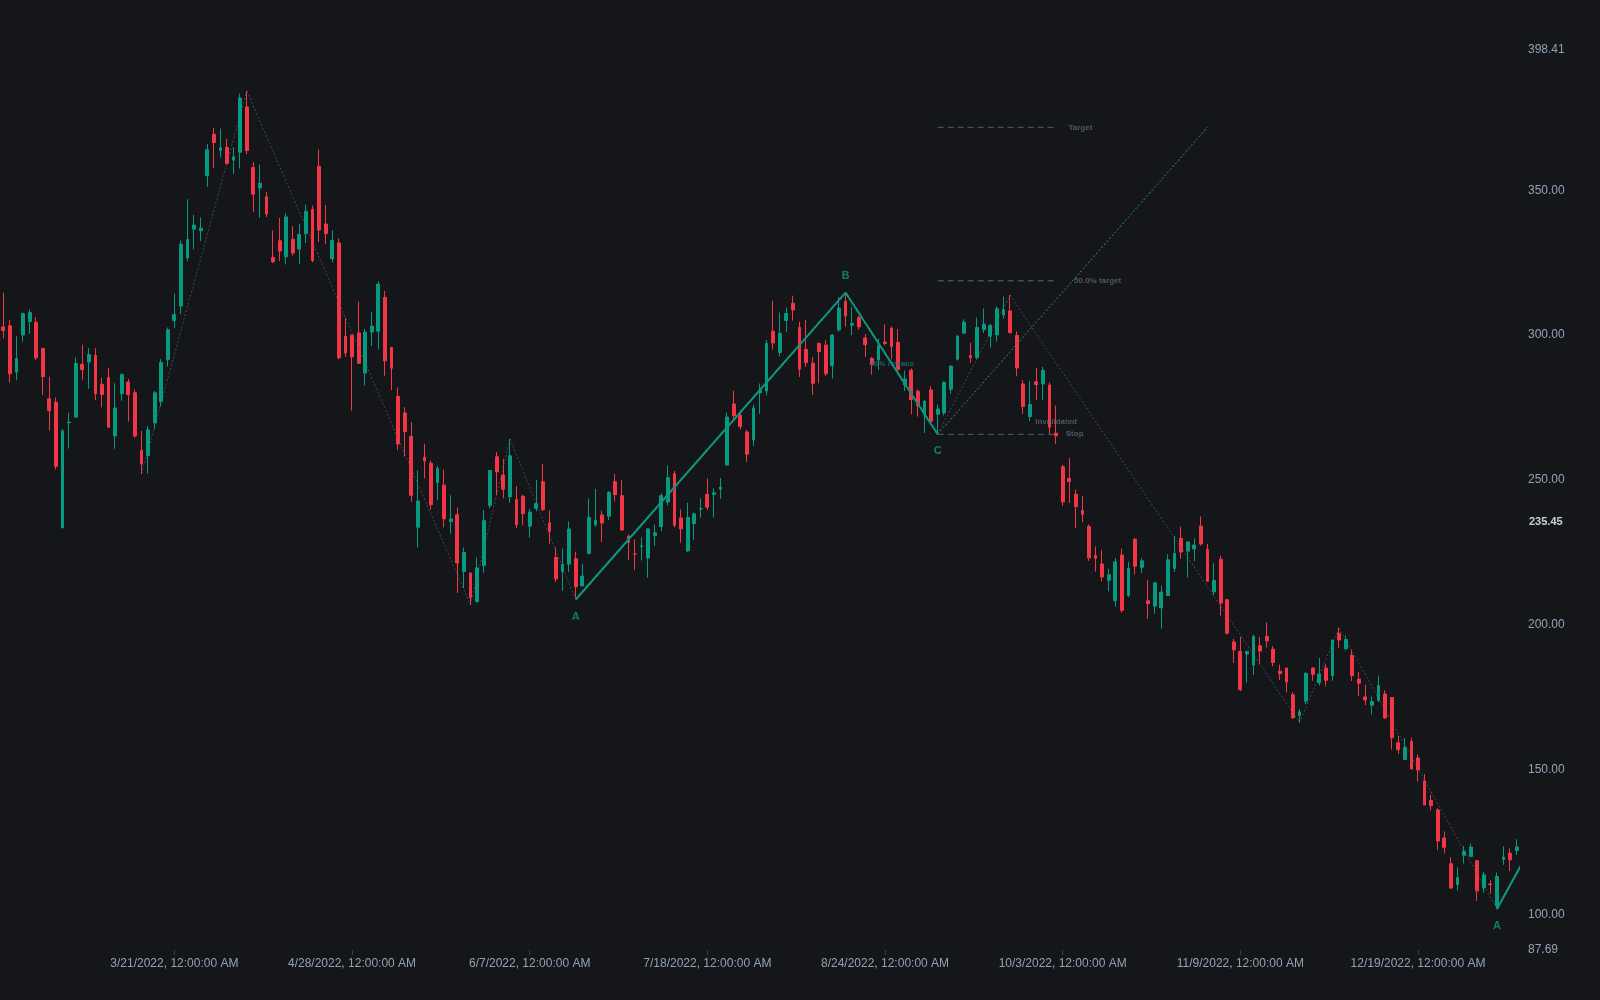
What is a Measured-Move Up/Down?
The measured-move up and its bearish mirror, the measured-move down, are three-part chart patterns: an initial trending leg, a corrective phase, and a second leg expected to roughly equal the first in length. In the bullish version price advances, retraces part of the gain in an orderly correction, then advances again by about the size of the first leg; the bearish version inverts every element. The pattern is formalized in Thomas Bulkowski's chart-pattern catalog, where it is defined, measured, and given failure statistics, though the underlying idea of symmetric legs is much older charting lore.
The premise is proportionality. Trends frequently unfold in two impulses of comparable magnitude separated by a rest, so once the first leg and the correction are in place, the first leg's length projected from the correction's end supplies a price objective. The same symmetry logic drives the broader measured move projection technique and the ABCD harmonic structure.
Bulkowski's samples give the honest calibration: the second leg approximates the first often enough to make the projection useful as a guide, but full-target completion is far from certain, and his own guidance treats fractions of the projection as more dependable than the full extension. The pattern is therefore best understood as an expectation-setting framework, most valuable for knowing where a trend has done what it typically does and may be finished.
How to identify a measured move on a chart
The pattern is only fully confirmed in hindsight; in real time you identify the first two parts and project the third.
- 1Find a clean first leg: a persistent, roughly straight trend segment with well-defined start and end swing points.
- 2Wait for the corrective phase: a countertrend retracement, commonly in the vicinity of a third to two-thirds of the first leg, that is orderly rather than a full collapse.
- 3Mark the correction's end: the swing low (bullish) or swing high (bearish) where price turns back in the trend direction.
- 4Project the first leg's length from that turning point to obtain the objective, optionally cross-checking with a fib extension near 100 percent.
- 5Treat a correction that retraces most of the first leg as disqualifying; symmetry projections from a failed trend mean little.
- 6Track the second leg against the projection, remembering that partial completion is the more common outcome.
How traders use it
- Target setting: traders long from the correction's end use the projected leg equality as a profit objective, often scaling out ahead of the full target given the completion statistics.
- Entry framing: the corrective phase itself is the entry zone, with the turn back in the trend direction as the trigger and the correction's extreme as the stop, so the pattern doubles as a pullback playbook with a built-in objective.
- Exhaustion warning: when a trend has completed a full measured move, continuation is statistically less generous, so trend followers tighten stops or stop adding near the projection.
- Limitations: leg symmetry is a tendency, not a mechanism, and volatile markets routinely overshoot or undershoot; the projection should adjust position management, not override it.
Measured moves vs. related projections
Measured Move: The market-structure measured move is the general leg-projection technique applied anywhere; this page covers the specific catalogued chart pattern with defined legs, correction, and published statistics.
ABCD: The ABCD is the harmonic-trading formalization of the same shape, adding Fibonacci ratio requirements between the legs; the measured move only asks for approximate equality.
Measure Rule: The measure rule projects a pattern's height from its breakout point; the measured move projects a prior trend leg from a correction's end, a projection of motion rather than of a pattern's size.
Concept family
Chart & Candlestick Patterns
84 concepts mapped · 84 in the Library
Measured-move Up/down FAQ
Turn Measured-move Up/down into a trading strategy.
Take the implementation from this page into Quant, then build on it, backtest it on real data, and keep refining it in conversation.