Concept
Murrey Math Levels
Murrey Math Levels are Support/Resistance & Levels concepts. The Library holds 1 implementation, a working definition you can pull into Quant.
Top Murrey Math Levels indicator
The top custom implementation, built on the original standard Murrey Math Levels formula.
1 total
From studying Murrey Math Levels to trading it: take the implementation below into Quant and backtest it instantly.
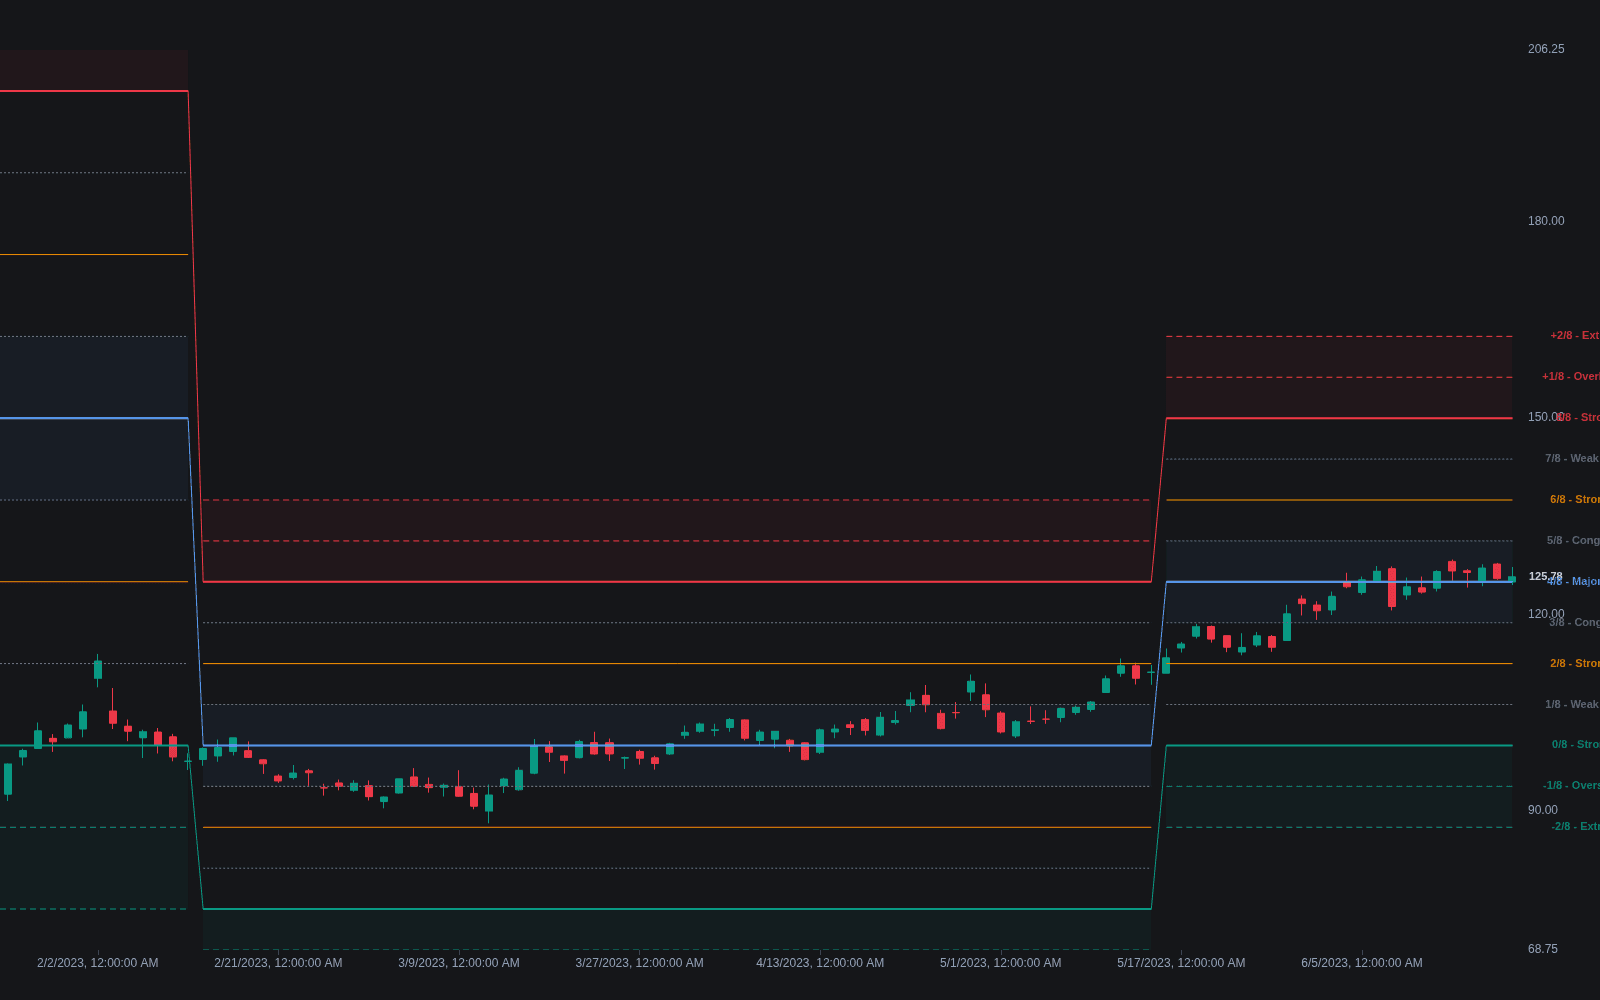
What are Murrey Math Levels?
Murrey Math levels are an algorithmic grid of nine horizontal lines, 0/8 through 8/8, dividing a reference frame of price into eighths, with overshoot lines at +1/8 and +2/8 above and -1/8 and -2/8 below. T.H. Murrey published the system in the 1990s as a mechanical restatement of Gann's habit of dividing price into eighths: the frame is derived from the recent high-low range, snapped to a scale that subdivides powers of ten into halves, quarters, and eighths to suit the instrument's magnitude. The grid therefore recomputes itself as new frames complete instead of depending on hand-drawn judgment.
Murrey's mid-1990s book presented the system as Gann simplified for ordinary traders: where Gann's price-time work demands judgment at every step, Murrey Math fixes the octave arithmetic so that any two users of the same settings see the same nine lines. That mechanical honesty is the system's real innovation, and it is also why the grid behaves like a utility rather than a theory; the lines are where the arithmetic puts them, meaningful only insofar as price treats them as references.
Each line has a conventional role in Murrey's vocabulary: 0/8 and 8/8 are the strongest support and resistance; 4/8 is the major pivot separating bullish from bearish territory; 3/8 and 5/8 bound the congestion band where the system expects price to spend much of its time; 2/8 and 6/8 are strong reversal candidates; 1/8 and 7/8 are weak stall levels. These labels are conventions of the system, not verified statistics, and like Gann Square-of-9 levels the grid earns trust only where price actually reacts to it.
The practical variables are the frame and the snap. Implementations differ in the lookback that defines the frame's high and low (with 64 bars a common convention) and recompute the grid when price escapes or a new frame completes, so levels jump rather than drift; the snapped scale means lines sit at clean fractions that often coincide with round numbers. As with any formula grid, standing rises with confluence: a 4/8 that lands on a prior period level or a well-tested S/R zone is a stronger reference than an eighth line alone.
How to read Murrey Math levels on a chart
The grid draws itself; reading it means knowing each line's conventional role and validating against actual reactions.
- 1Apply the indicator and note its frame settings: the lookback defining the range (64 bars is a common default) and the octave scale it snapped to.
- 2Locate 4/8 first: the midline is the system's bull-bear pivot, and price's side of it sets the conventional bias.
- 3Mark the extremes: 0/8 and 8/8 are the frame's strongest support and resistance, with the +/-1/8 and +/-2/8 overshoot octaves beyond them.
- 4Note the congestion band: 3/8 to 5/8 is where the system expects rotational trade, so range tactics apply inside it.
- 5Validate before trusting: track how price actually behaves at 2/8, 4/8, and 6/8 on the instrument; a grid that draws reactions earns weight, one that price ignores is decoration.
- 6Expect recomputes: when price accepts beyond the frame or a new frame completes, the whole ladder jumps to new prices by design.
How traders use it
- As a range map: fade approaches to 2/8 and 6/8 back toward 4/8 while price rotates inside the frame, and stand aside or switch to breakout tactics when price closes beyond 0/8 or 8/8 into the overshoot octaves.
- As a bias line: above 4/8 favor longs toward 5/8 and 6/8, below it favor shorts, treating 4/8 the way midpoint traders treat the middle of any established range.
- As confluence: a Murrey line coinciding with a prior high, a volume shelf, or a session level carries more weight than the grid alone, and distance from 4/8 is sometimes read oscillator-style as a stretch measure.
- As a level ladder for management: entries at one octave line are staged against the next, stops beyond the line behind, targets at the line ahead, standard level interaction mechanics applied to a fixed grid.
- As a cross-check against session formulas: comparing the grid with floor pivots or Camarilla levels finds the prices where independent arithmetic agrees, the same confluence habit used with measured levels.
Murrey Math vs other formula grids
Floor Pivots: Floor pivots recompute each session from the prior period's high, low, and close, landing wherever that arithmetic says. Murrey lines snap a frame onto fixed octave fractions, so they sit at clean scale divisions and persist until the frame itself changes.
Camarilla: Camarilla levels multiply the prior day's range by fixed coefficients around the close, tuned for intraday fades. Murrey's ladder is frame-based rather than session-based, with a vocabulary of roles per line instead of a fade-at-H3/L3 playbook.
Fib Retracement: A retracement measures a chosen swing and inherits its anchors' subjectivity. Murrey Math removes the choosing: the frame algorithm picks the range and the eighths are fixed, trading measurement nuance for mechanical repeatability.
Concept family
Support/Resistance & Levels
38 concepts mapped · 38 in the Library
Murrey Math Levels FAQ
Turn Murrey Math Levels into a trading strategy.
Take the implementation from this page into Quant, then build on it, backtest it on real data, and keep refining it in conversation.