Concept
Anchored VWAP As Level
Anchored VWAP As Level is a Support/Resistance & Levels concept. The Library holds 1 implementation, a working definition you can pull into Quant.
Top Anchored VWAP As Level indicator
The top custom implementation, built on the original standard Anchored VWAP As Level formula.
1 total
This Anchored VWAP As Level implementation is strategy-ready: open it in Quant, set your rules, and it backtests automatically.
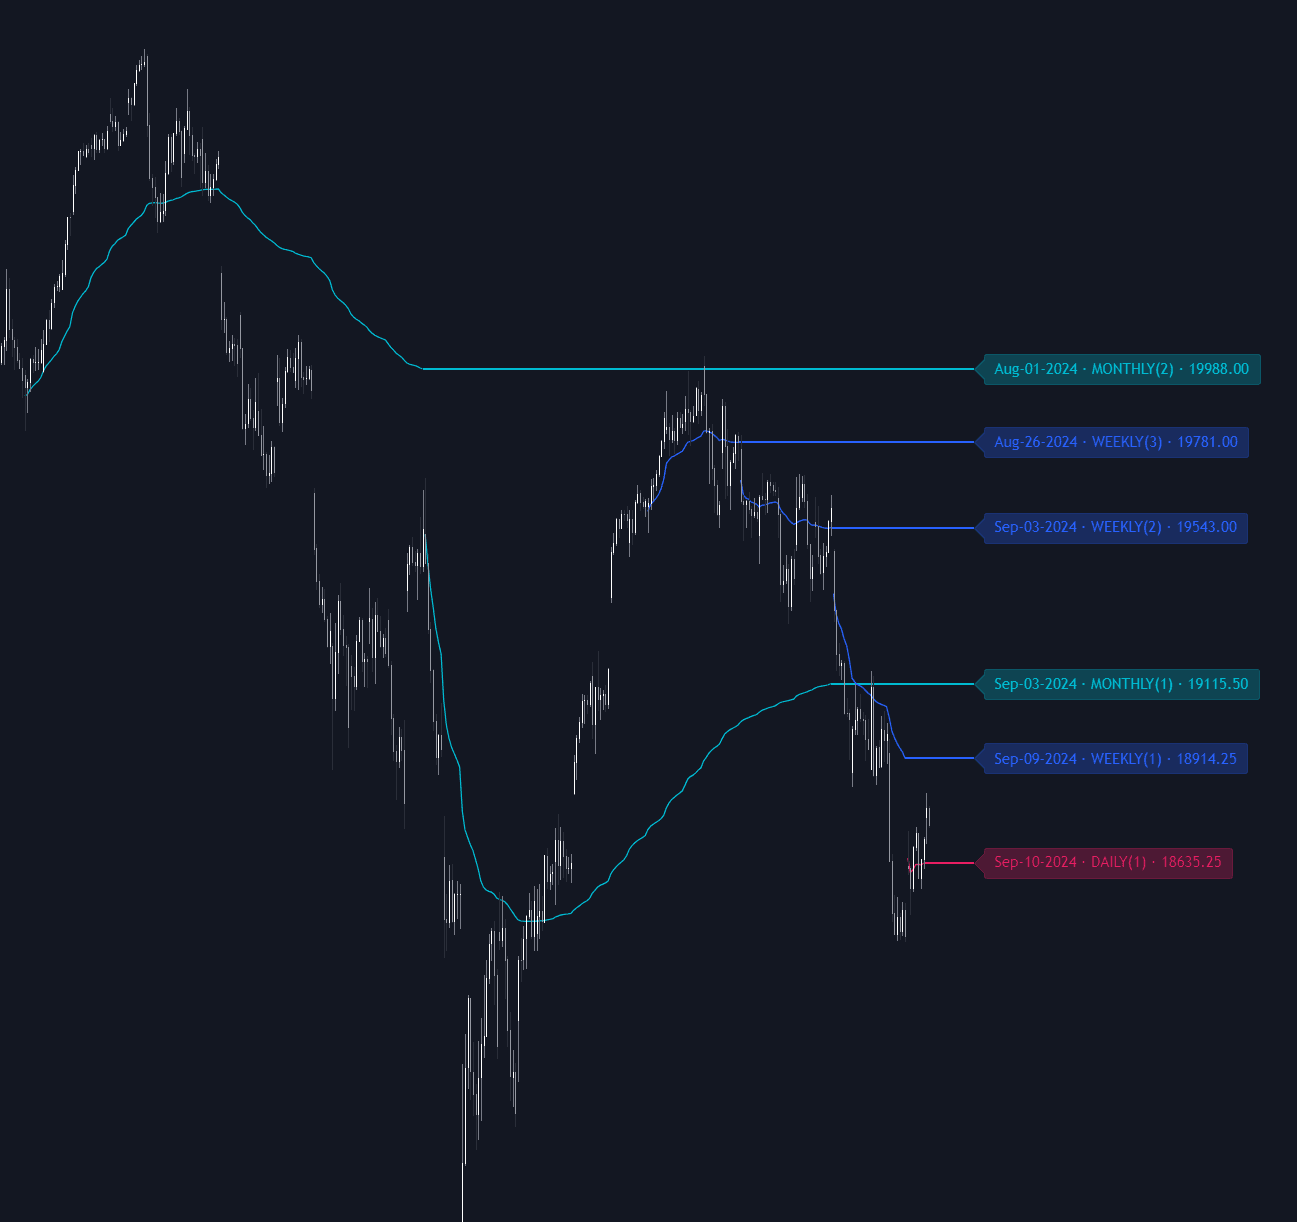
What is Anchored VWAP As Level?
Anchored VWAP as level is the practice of trading an anchored VWAP, the volume-weighted average price measured from a chosen event forward, as support and resistance in its own right. The line answers one question: what has the average participant paid, weighted by volume, since the anchor? Anchored to a major swing low, an earnings gap, or a breakout bar, it becomes the running break-even of everyone positioned since that event, so a return to the line tests a specific cohort rather than an arbitrary price. The idea descends from Paul Levine's MIDAS studies of the mid-1990s, which launched VWAP curves from reversal points, and was later popularized as a general anchoring workflow by Brian Shannon.
The level logic is positional. While price holds above a rising anchored VWAP, the average buyer since the anchor is in profit, and pullbacks into the line are where that cohort can defend break-even and latecomers find average cost. Acceptance below the line leaves the same cohort trapped, and retests from beneath are then watched as resistance, a volume-weighted form of role reversal. None of this is guaranteed: the line is a reference for observing whether a cohort is defending, and a clean failure there is as informative as a hold.
Mechanically the line differs from every horizontal reference because it keeps moving. Each new bar folds its volume into the cumulative average, so the level drifts toward wherever business is being done, and its sensitivity decays as the anchor ages: early on, one heavy session can bend the line visibly, while months later the accumulated volume behind it makes the level slow and stable. That maturing behavior is part of the read. A young anchored VWAP hugging price says the market is still trading near the cohort's cost; an old, flat one sitting far away marks a deep, slow reference that only major moves revisit.
The practice matters because it adds an independent source of levels to a chart otherwise built from price memory. Horizontal references such as a support level or resistance level mark where price reversed before; an anchored VWAP marks where the money is even when price never reversed there. The two families are strongest together: a test of a prior low that also lands on the anchored line from the last major high is a double argument for a reaction, the same confluence logic behind an S/R zone built from several inputs.
How to identify anchored VWAP levels on a chart
The level is only as meaningful as its anchor, so identification starts with the event, not the line.
- 1Pick the anchor bar: a major swing high or low, an earnings or news gap, a breakout bar, an IPO day, or a year or quarter open. The test is whether a real cohort measures its position from that event.
- 2Apply the anchored VWAP tool from that bar and let it plot forward; the line is the cumulative volume-weighted average price since the anchor.
- 3Treat the line as a thin zone rather than an exact tick, since wick tests and close tests differ, the same tolerance you would give any S/R zone.
- 4Watch the first few interactions: rejection wicks and defended closes at the line show the cohort protecting its basis, while acceptance through it puts the role-reversal read in play under standard level interaction rules.
- 5Mark confluence where the moving line crosses fixed references such as prior period levels, floor pivots, or a Fib retracement; the overlap is a stronger zone than either input alone.
How it's calculated
The volume-weighted average price of all trading since a chosen anchor bar, tracked as a support and resistance level.
Typical price is the usual source; variants use the close or include the open in the average.
Session VWAP is the special case with the anchor at the session open.
Nothing before the anchor enters the sums, so the anchor choice defines the level.
How traders use it
- As trend pullback support: anchor at the event that started the move (a major low, a gap, a high-volume news bar) and watch the first returns to the line for defended tests, a volume- and event-aware cousin of dynamic S/R via MA.
- As a polarity line: once price accepts below an anchored VWAP from a significant low, retests from underneath are treated as resistance, and a later reclaim of the line is watched as an early repair signal.
- As a two-sided bracket: anchors from the last major high and the last major low frame the current auction, and compression between the two lines sets up the VWAP pinch resolution trade.
- As confluence: where the developing line crosses a horizontal reference such as prior period levels or a high-volume node, the overlap is treated as a stronger zone than either reference alone.
- As standing references: a small set of always-on anchors from the year open, the quarter open, and the last major pivot gives every chart a consistent frame, the anchored cousin of watching period opens as levels.
- As a stretch gauge: distance from the anchored line shows how far price has run from the cohort's average cost, which helps judge late entries and frames fade-back-to-the-line ideas in ranging conditions.
Anchored VWAP As Level vs related tools
Anchored VWAP: The parent concept is the calculation itself, which also serves trend reading and execution benchmarking; this page covers the narrower practice of trading the line as support and resistance.
Session VWAP: Session VWAP re-anchors automatically at every session open, so its cohort resets daily; an anchored VWAP is pinned to one chosen event and carries that cohort's cost basis for as long as you keep it on the chart.
Dynamic S/R Via MA: Moving averages also act as moving support and resistance, but they weight price over a fixed lookback; an anchored VWAP weights by traded volume from an event, so it tracks actual average cost rather than smoothed price.
Floor Pivots: Floor pivots are horizontal formula levels everyone computes identically from the prior session. An anchored VWAP moves with traded volume and depends on the anchor you chose, so it reflects a cohort's cost rather than a shared formula.
Concept family
Support/Resistance & Levels
38 concepts mapped · 38 in the Library
Anchored VWAP As Level FAQ
Turn Anchored VWAP As Level into a trading strategy.
Take the implementation from this page into Quant, then build on it, backtest it on real data, and keep refining it in conversation.