Concept
Camarilla
Camarilla, also known as day-type playbooks, is a Support/Resistance & Levels concept. The Library holds 1 implementation, a working definition you can pull into Quant.
L1–L5/H1–H5
Top Camarilla indicator
The top custom implementation, built on the original standard Camarilla formula.
1 total
The Camarilla implementation below can become a backtested trading strategy — describe your rules and Quant writes the code.
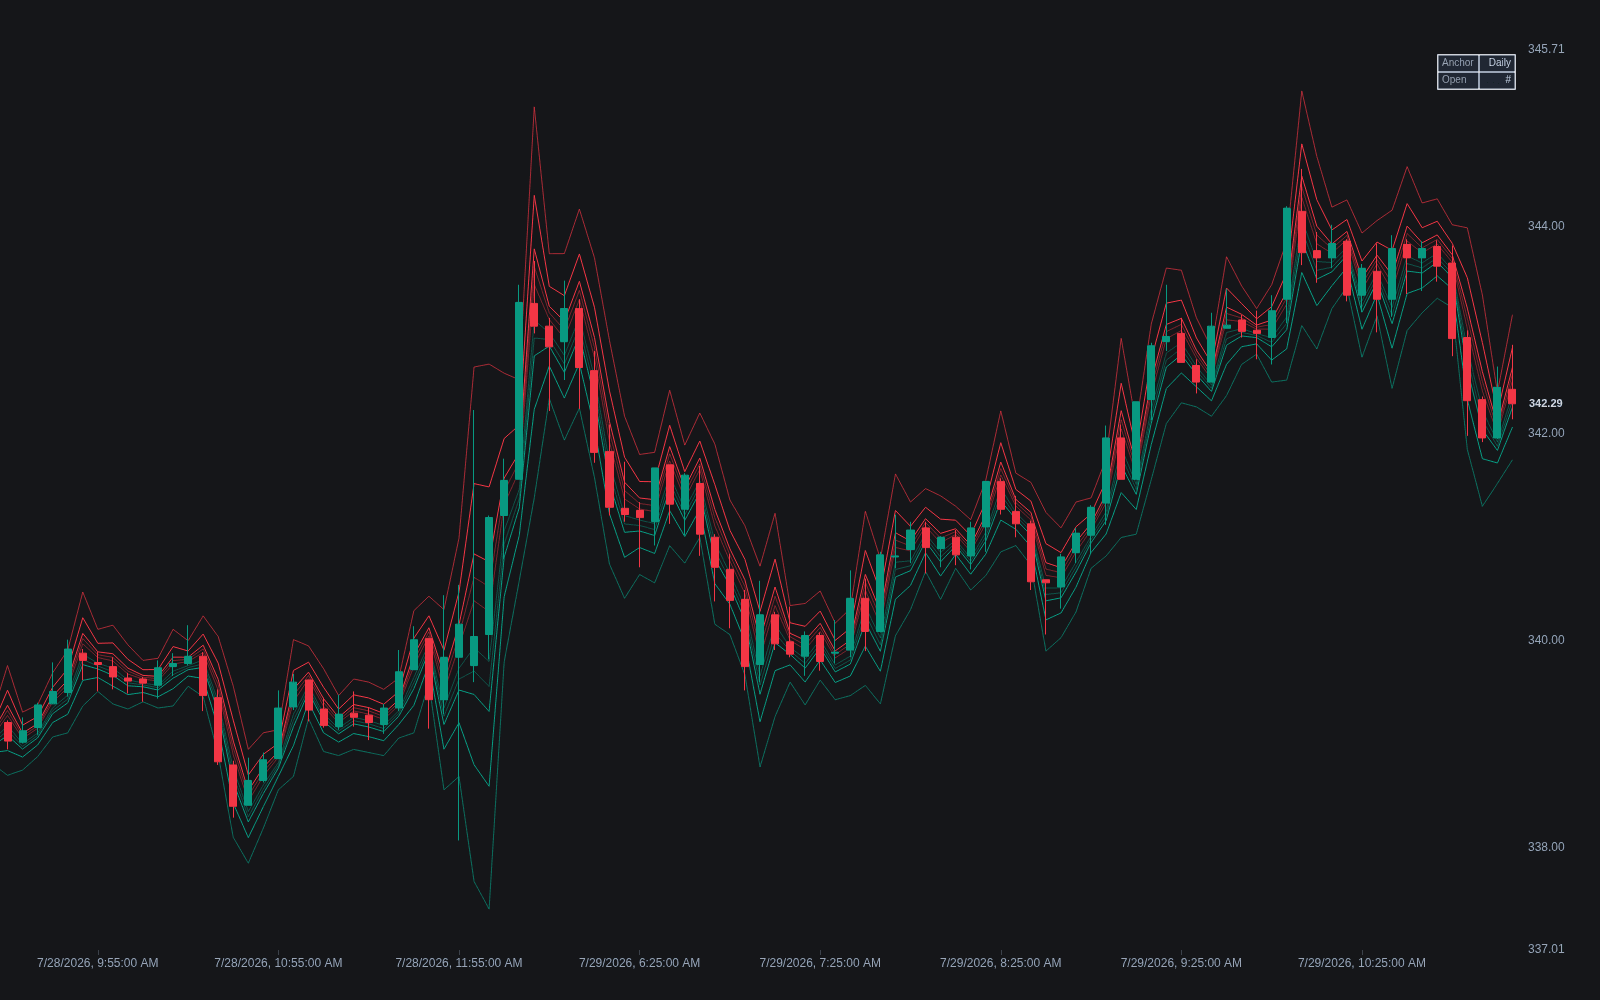
What is Camarilla?
Camarilla is a pivot framework that converts the prior session's range into a ladder of intraday support and resistance levels arranged around yesterday's close. Usually credited to a bond trader in 1989, the Camarilla equation takes the previous day's high, low, and close and projects four resistances above the close (H1 to H4) and four supports below it (L1 to L4), each offset by a fixed fraction of the prior range scaled by 1.1. Unlike floor pivots there is no averaged central pivot: every rung is measured from the close, reflecting the framework's mean-reversion premise that intraday trade often rotates around the prior settlement.
The ladder comes with role assignments. H3 and L3 (offset by 1.1/4 of the range) are the classic reversion rungs where fades back toward the other side are attempted; H4 and L4 (offset by 1.1/2 of the range) are the breakout rungs whose loss marks a potential trend day; H5 and L5 are later extensions used as trend-day targets. This is why Camarilla is often taught as a set of day-type playbooks: where the session opens within the ladder, and which rung it takes first, selects the plan (rotation between the level 3s or continuation beyond the level 4s).
How to calculate Camarilla levels
One prior period of data and one scaling constant produce the whole ladder.
- 1Take the prior session's high (H), low (L), and close (C). Daily bars are the standard input; weekly and monthly Camarilla apply the same math to larger bars. Compute the range R = H minus L.
- 2Scale the range by 1.1 and divide to get the offsets: R × 1.1/12 for level 1, R × 1.1/6 for level 2, R × 1.1/4 for level 3, and R × 1.1/2 for level 4.
- 3Add each offset to the close for H1 through H4 and subtract it for L1 through L4. Every level brackets the close itself; there is no (H + L + C) / 3 midpoint anywhere in the construction.
- 4Treat H5 and L5 as non-standard extensions. A common variant computes H5 = (H / L) × C and places L5 the same distance below the close, but formulas differ across sources, so confirm which one your charts use before trading them.
How traders use it
- Range-day fades: when price opens and holds inside the band between L3 and H3, the classic play is shorting tests of H3 and buying tests of L3, targeting rotation across the trading range with stops beyond the level-4 rungs. On trend days these fades simply fail, so most playbooks require rejection behavior at the rung, not a touch alone.
- Trend-day breakouts: a push through H4 or L4 is read as a breakout into trend conditions and traded with the move toward H5 or L5, while a quick re-entry back inside the ladder is the standard false breakout warning.
- Day-type selection at the open: the opening print's location relative to the ladder chooses the playbook. Opening between L3 and H3 favors rotation tactics; opening or quickly pushing beyond H4 or L4 favors continuation or gap logic. The framework is a decision tree, not a single setup.
- Confluence filtering: rungs that land on independently derived references (prior session extremes, VWAP, high-volume levels) are prioritized over rungs floating in empty space.
Camarilla vs other pivot frameworks
Floor Pivots: Floor pivots build outward from an averaged central pivot at (H + L + C) / 3; Camarilla skips the average and hangs all eight rungs directly off the prior close, with inner levels sitting much tighter to price.
Fibonacci Pivots: Fibonacci pivots scale the prior range by 38.2%, 61.8%, and 100% around the central pivot; Camarilla scales by 1.1/12 through 1.1/2 around the close, a convention from its author rather than the Fibonacci sequence.
Central Pivot Range: CPR classifies the coming day by the width and placement of a three-line band around the classic pivot; Camarilla classifies it by which rungs the session opens between and breaks. Both are day-type tools, which is why they are often plotted together.
Concept family
Support/Resistance & Levels
38 concepts mapped · 38 in the Library
Camarilla FAQ
Turn Camarilla into a trading strategy.
Take the implementation from this page into Quant, then build on it, backtest it on real data, and keep refining it in conversation.