Concept
Fib Clusters
Fib Clusters are Support/Resistance & Levels concepts. The Library holds 1 implementation, a working definition you can pull into Quant.
confluence of multiple draws
Top Fib Clusters indicator
The top custom implementation, built on the original standard Fib Clusters formula.
1 total
From studying Fib Clusters to trading it: take the implementation below into Quant and backtest it instantly.
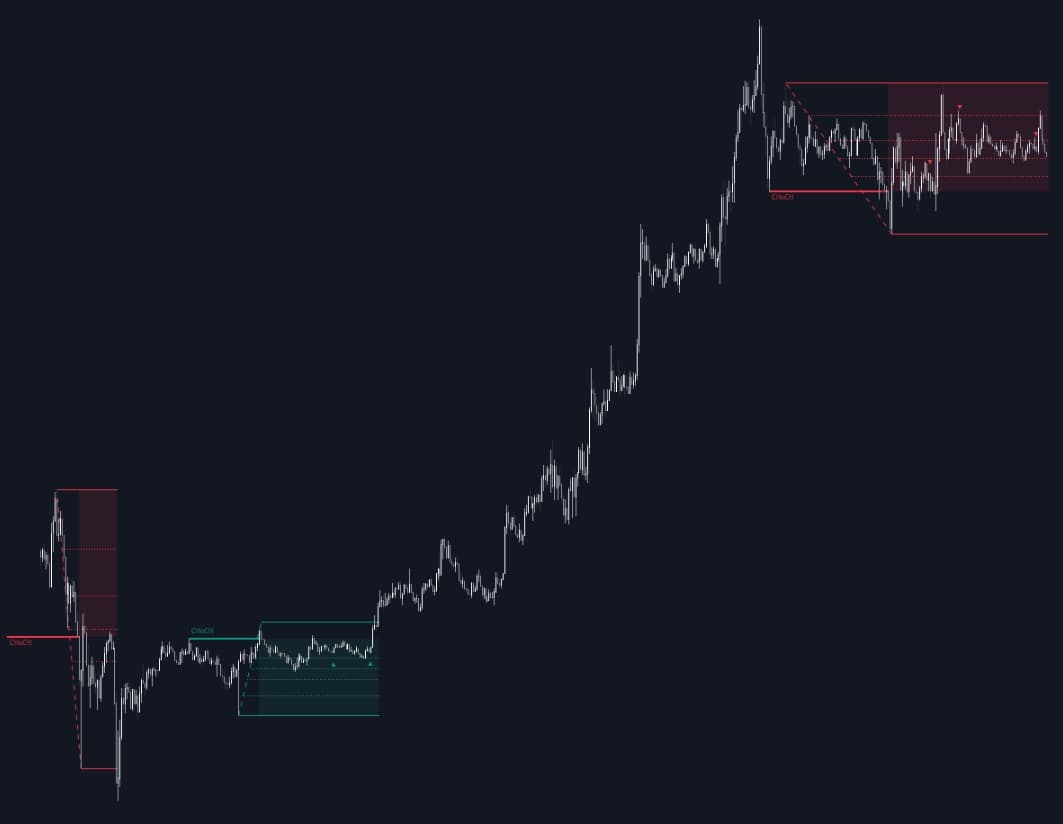
What are Fib Clusters?
Fib clusters are price zones where several independent Fibonacci measurements land on top of each other: a retracement of one swing, an extension of another, a projection from a third, often taken from different pivots or different timeframes. Any single Fibonacci draw depends entirely on its anchors, which makes isolated levels easy to overfit. The confluence logic is a defense against that arbitrariness: when measurements from unrelated anchors agree on a narrow band, the level is less likely to be an artifact of one person's swing selection.
Confluence-based Fibonacci work has been taught for decades: Robert Fischer's 1990s books formalized multi-swing measurement grids, and Carolyn Boroden's trading work built a whole methodology on price zones where three or more relationships stack, popularizing the vocabulary most retail platforms now echo. The tooling followed, with scanners and toolkits automating what was originally a patient exercise in drawing every meaningful swing by hand.
The idea is baked into other frameworks. Harmonic traders' potential reversal zone is a Fib confluence zone by construction, the overlap of ratios measured from each leg of the pattern. The tighter the band and the more distinct the contributing draws, the more the zone is trusted; a loose scatter of levels is just noise with extra lines.
Computed versions make the definition explicit. Automated tools collect candidate levels from every qualifying swing, bin them within a tolerance, and score each bin by count, draw diversity, and timeframe weight, the Fibonacci-specific case of general level clustering algorithms. The same scoring logic extends to mixed confluence, where a Fib band gains further standing by coinciding with independent references such as prior period levels, floor pivots, or a well-tested S/R zone.
How to identify a Fib cluster on a chart
The exercise is measuring several real swings and looking for agreement, not decorating one swing with more ratios.
- 1Select the meaningful swings: the last two or three significant legs on the trading timeframe, plus the dominant leg one timeframe up.
- 2Measure each independently: retracements of the corrective legs, extensions and projections of the impulse legs, each from its own genuine pivots.
- 3Mark where levels from different draws land within a tight tolerance of each other; two agreeing draws is minimum confluence, three or more from distinct anchors is proper confluence.
- 4Respect width discipline: the zone spans the overlapping levels only, and a band wide enough to catch everything proves nothing.
- 5Upgrade zones that also coincide with non-Fibonacci references, such as a period open, a pivot formula level, or a tested support or resistance level.
- 6Plan around the zone's edges: reaction entries, stops beyond the far edge, and invalidation on acceptance through it, per standard level interaction rules.
How it's calculated
Price zones where Fibonacci levels drawn from several different swings coincide, read as stronger support or resistance than any single level.
Carolyn Boroden's confluence method looks for at least three coincident Fibonacci price relationships within a tight range.
There is no universal standard for swing selection, ratio sets, or grouping tolerance, so zones vary across implementations.
The retracement formula handles both swing directions because B_j - A_j keeps its sign.
How traders use it
- To rank levels: traders sort candidate zones by how many independent draws agree within a tight band, trading the confluent zones and ignoring one-off levels.
- As target stacking: extensions and projections from several legs that converge at one area make a natural take-profit zone, since multiple measurement styles point to the same shelf.
- To frame risk around the zone rather than a line: entries, stops, and invalidation reference the zone's edges instead of any single ratio inside it.
- As an automation layer: confluence toolkits compute every qualifying draw and surface only the scored bands, which removes the anchor-shopping temptation that manual Fibonacci work invites.
- As cross-family confluence: a Fib band that overlaps a Fibonacci pivot, a Camarilla level, or a mapped supply or demand zone is treated as a first-class level, two unrelated methods having voted for the same price.
Fib Clusters vs related level constructions
Fib Retracement: A retracement is one swing's ratio grid, fully hostage to its two anchors. Clusters demand agreement across several independent draws, which is the difference between a hypothesis and a vote.
Level Clustering Algorithms: Clustering algorithms generalize the idea: bin and score levels from any source, Fibonacci or otherwise, into zones. Fib clusters are the special case where all the inputs are Fibonacci measurements.
Fibonacci Pivots: Fibonacci pivots apply fixed ratios to the prior period's range through a formula, identical for everyone. Fib clusters emerge from measured swings someone chose, so they carry more information when honest and more bias when not.
Concept family
Support/Resistance & Levels
38 concepts mapped · 38 in the Library
Fib Clusters FAQ
Turn Fib Clusters into a trading strategy.
Take the implementation from this page into Quant, then build on it, backtest it on real data, and keep refining it in conversation.