Concept
Woodie Pivots
Woodie Pivots are Support/Resistance & Levels concepts. The Library holds 1 implementation, a working definition you can pull into Quant.
Top Woodie Pivots indicator
The top custom implementation, built on the original standard Woodie Pivots formula.
1 total
This Woodie Pivots implementation is strategy-ready: open it in Quant, set your rules, and it backtests automatically.
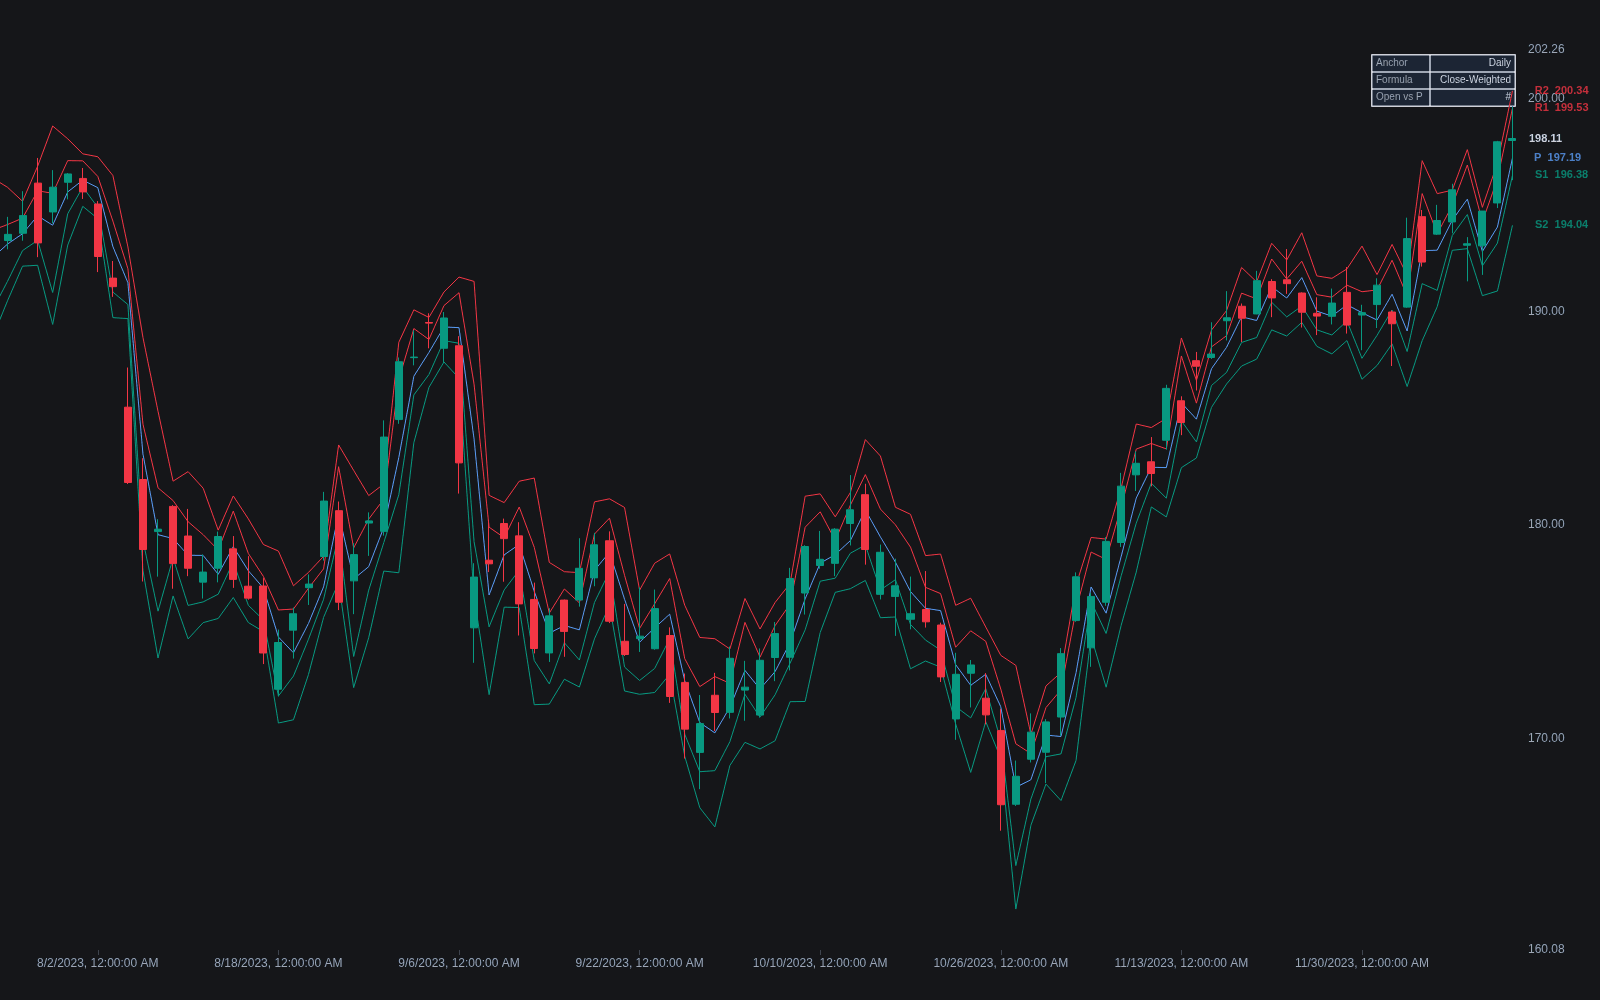
What are Woodie Pivots?
Woodie pivots are a variant of the classic pivot-point set, named for the trader Ken Wood (Woodie), that changes the weighting of the central pivot. Where floor pivots average the prior period's high, low, and close equally, the most widespread Woodie formulation double-weights the close: pivot = (prior high + prior low + 2 x prior close) / 4. The surrounding levels follow the familiar structure: R1 = 2 x pivot minus the prior low, S1 = 2 x pivot minus the prior high, with R2 and S2 adding or subtracting the prior high-low range.
Definitions vary by source. Implementations closer to the original convention substitute the current session's open for the close, so the pivot absorbs the overnight gap and the whole ladder shifts to reflect where today actually opened. Both versions coexist on charting platforms, which is why two Woodie overlays can disagree on the same chart; check which input yours uses.
The name comes from Ken Wood, who ran a large free online trading community in the early 2000s and is best known for his CCI-based methods. The pivot calculation that circulated under his name spread from there into mainstream charting packages alongside the classic floor formula. The open-based formulation matches an intraday focus: index futures routinely gap overnight, and a pivot anchored purely to yesterday's close can leave the entire ladder stranded away from where trading actually resumes.
Like every pivot calculation, Woodie levels are objective: anyone using the same inputs and session definition draws identical lines before the session begins, which removes the discretion involved in hand-drawing an S/R zone. That objectivity is also the honest limit of the tool. The levels are arithmetic projections from one prior period, not memories of actual transactions, so their value comes from how price behaves on arrival, and many traders formalize those reactions with explicit level interaction rules rather than assuming every touch will hold.
How to identify Woodie pivots on a chart
Woodie pivots are computed rather than drawn, so identification is about applying the right calculation and confirming which variant you are looking at.
- 1Apply a pivot-point indicator that offers a Woodie mode and choose the anchor period: prior day for intraday charts, prior week or month for swing timeframes.
- 2Verify the formula. Hand-calculate the central pivot from yesterday's high, low, and close; if it does not equal (high + low + 2 x close) / 4, the tool is likely using the open-based variant.
- 3Read the ladder: the central pivot in the middle, R1 and R2 above, S1 and S2 below. Note where the session opens relative to the pivot, since many playbooks key off that relationship.
- 4Overlay the classic floor calculation to see the difference: after a strong directional day or an opening gap the two pivots separate, and the distance between them shows how much the extra close or open weighting mattered.
- 5Mark confluences where a Woodie level lands near an independent reference such as a prior period level or a period open; agreement between unrelated calculations is what most practitioners actually trade.
How traders use it
- As an intraday S/R ladder: like other pivot sets, the levels are computed once from the prior period and left in place, with the central pivot read as the session's bias line (trade above it favors longs, below it favors shorts).
- When gaps matter: the open-based variant is favored by traders who want the overnight gap priced into the levels rather than anchoring everything to yesterday's close.
- In multi-set comparisons: some traders overlay Woodie, Camarilla, and Fibonacci pivots and give extra weight to prices where several calculations agree.
- For targets and stop placement: a long taken at the pivot commonly uses R1 as the first objective with a stop beyond the nearest level below, keeping risk defined by prices that existed before the trade.
- As a swing framework on higher anchors: weekly and monthly Woodie pivots give position traders support and resistance references that update only once per period.
- As one input in confluence checks: a Woodie level that coincides with an independent reference such as a major option strike or a prior weekly extreme tends to attract more attention than a level standing alone.
Woodie pivots vs. other pivot calculations
Floor Pivots: Identical architecture, different center: floor pivots weight the prior high, low, and close equally, while Woodie double-weights the close or substitutes the open. After quiet mid-range closes the two ladders nearly overlap; after trend days or gaps they diverge.
Camarilla: Camarilla projects its levels from the prior close using fractions of the range, and its playbook centers on fading moves into R3/S3. Woodie keeps the classic pivot grammar of a central bias line with symmetric supports and resistances.
Fibonacci Pivots: Fibonacci pivots keep the standard central pivot but space the R and S levels at 38.2%, 61.8%, and 100% of the prior range. Woodie changes the pivot itself and keeps the standard spacing.
Prior Period Levels: Prior period levels mark where price actually traded, such as yesterday's high, low, and close, while Woodie levels are arithmetic projections from those prices. Many intraday traders plot both and treat agreement between them as the signal.
Concept family
Support/Resistance & Levels
38 concepts mapped · 38 in the Library
Woodie Pivots FAQ
Turn Woodie Pivots into a trading strategy.
Take the implementation from this page into Quant, then build on it, backtest it on real data, and keep refining it in conversation.