Concept
Fib Geometry Tools
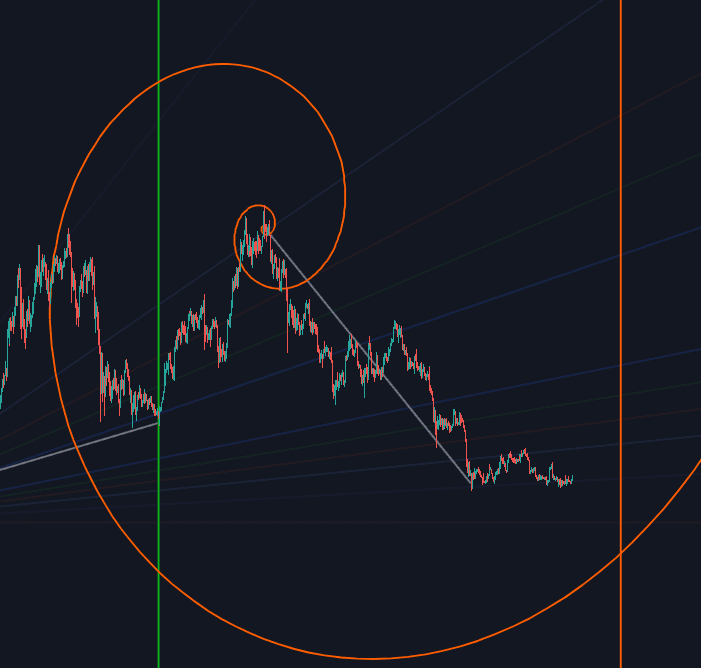
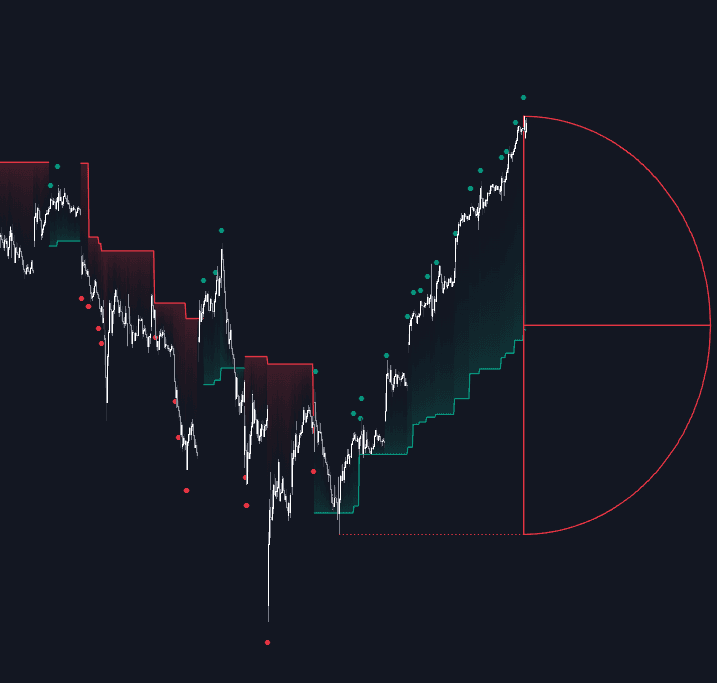
Fib Geometry Tools, also known as fans, arcs, circles, spirals, are Support/Resistance & Levels concepts. The Library holds 2 implementations, each one a working definition you can pull into Quant.
Top Fib Geometry Tools indicators
The top custom implementations, built on the original standard Fib Geometry Tools formula.
2 total
Want to trade Fib Geometry Tools? Any of the 2 implementations below is one prompt away from a backtested strategy in Quant.
What are Fib Geometry Tools?
Fib geometry tools are the family of Fibonacci drawings that project ratio relationships as geometry instead of horizontal lines: fans (sloped rays), arcs and circles (curves at ratio-scaled radii), spirals (golden-ratio expansion curves), and channels (parallels spaced at ratio fractions and multiples of a base width). They start from the same input as a standard Fib retracement, an anchor swing from a significant low to high or high to low, but instead of dividing only the vertical price distance they divide slope, radius, or channel width at the familiar ratios, most commonly 38.2%, 50%, and 61.8%.
The practical difference is that the geometry evolves with time: a fan ray or arc sits at a different price on every bar, so the tool proposes where a pullback might find support and, loosely, when. That comes at a cost. Arcs, circles, and spirals are drawn in chart space, so their shape depends on the chart scale and aspect ratio, and every tool in the family inherits the subjectivity of the anchor choice. Most practitioners treat these drawings as a confluence layer over structure and horizontal levels rather than as standalone signals.
How to draw Fib geometry tools
Every tool in the family starts with the same decision, the anchor swing, and differs only in what it does with it.
- 1Choose the anchor swing: a clean impulse from swing low to swing high (or high to low) on your trading timeframe. The drawing is only as meaningful as this choice, and two traders can reasonably pick different swings.
- 2For a fan, divide the vertical distance at the swing's end point at 38.2%, 50%, and 61.8%, then draw rays from the swing's origin through each division. The rays extend forward as sloped support or resistance.
- 3For arcs and circles, sweep curves centered on the swing's end point with radii at those same fractions of the swing. Price can meet a curve by moving in price, by drifting sideways in time, or both.
- 4For channels, copy the base trendline at Fibonacci fractions and multiples of the channel's width; for spirals, wind outward from the anchor so the radius grows by the golden ratio each quarter turn in the classic construction (implementations vary). Verify curved tools on your working scale, since arcs, circles, and spirals reshape with chart scaling and aspect ratio in a way straight-line fans and channels do not.
How it's calculated
Chart drawings that project Fibonacci ratios of a chosen price swing as fan rays, arcs and circles, parallel channels, or a golden spiral.
Fan levels are pure price ratios, but arcs, circles, and spirals depend on chart scale, so their shape changes with zoom and differs across platforms.
The ratios come from the Fibonacci sequence: quotients of consecutive terms approach 0.618 = 1 / φ, and 0.382 = 0.618^2.
Exact centers, ratio sets, and full-circle versus half-arc rendering are platform conventions rather than a single standard.
How traders use it
- As sloped pullback support in a trend: after an impulse, traders watch the 38.2% fan ray first, then the 50% and 61.8% rays, reading how deep into the fan a retracement cuts before a ray holds. Losing the last ray puts the anchored trend itself in question.
- As a price-and-time read: arcs and circles keep receding or advancing as bars elapse, so the same pullback depth means something different early versus late in a correction. They pose the question that Fib time tools ask on the time axis alone, combined with price.
- As graded channel targets: a Fib channel subdivides and extends a parallel channel at ratio fractions and multiples of its width, giving reference lines for overshoots beyond the original channel.
- As confluence input: spots where a ray or arc crosses a horizontal retracement, prior high, or structural level draw more attention than either line alone, the same stacking logic formalized by Fib clusters.
Fib geometry tools vs similar drawings
Fib Retracement: A retracement divides only the swing's vertical price range into horizontal levels; geometry tools divide slope, radius, or width, so the implied level changes as time passes.
Gann Fan & Angles: A Gann fan's rays have fixed price-per-time slopes (the 1x1 line plus set steeper and shallower ratios such as 2x1 and 1x2) set by a unit convention; a Fib fan's slopes come from ratio divisions of one specific anchor swing.
Speed Resistance Lines: Same construction as a Fib fan, but the vertical distance is divided into thirds (1/3 and 2/3) rather than Fibonacci ratios, a convention associated with Edson Gould.
Concept family
Support/Resistance & Levels
38 concepts mapped · 38 in the Library
Fib Geometry Tools FAQ
Turn Fib Geometry Tools into a trading strategy.
Take any implementation from this page into Quant, then build on it, backtest it on real data, and keep refining it in conversation.