Concept
Golden Pocket
Golden Pocket is a Support/Resistance & Levels concept. The Library holds 1 implementation, a working definition you can pull into Quant.
0.618–0.65
Top Golden Pocket indicator
The top custom implementation, built on the original standard Golden Pocket formula.
1 total
Want to trade Golden Pocket? The implementation below is one prompt away from a backtested strategy in Quant.
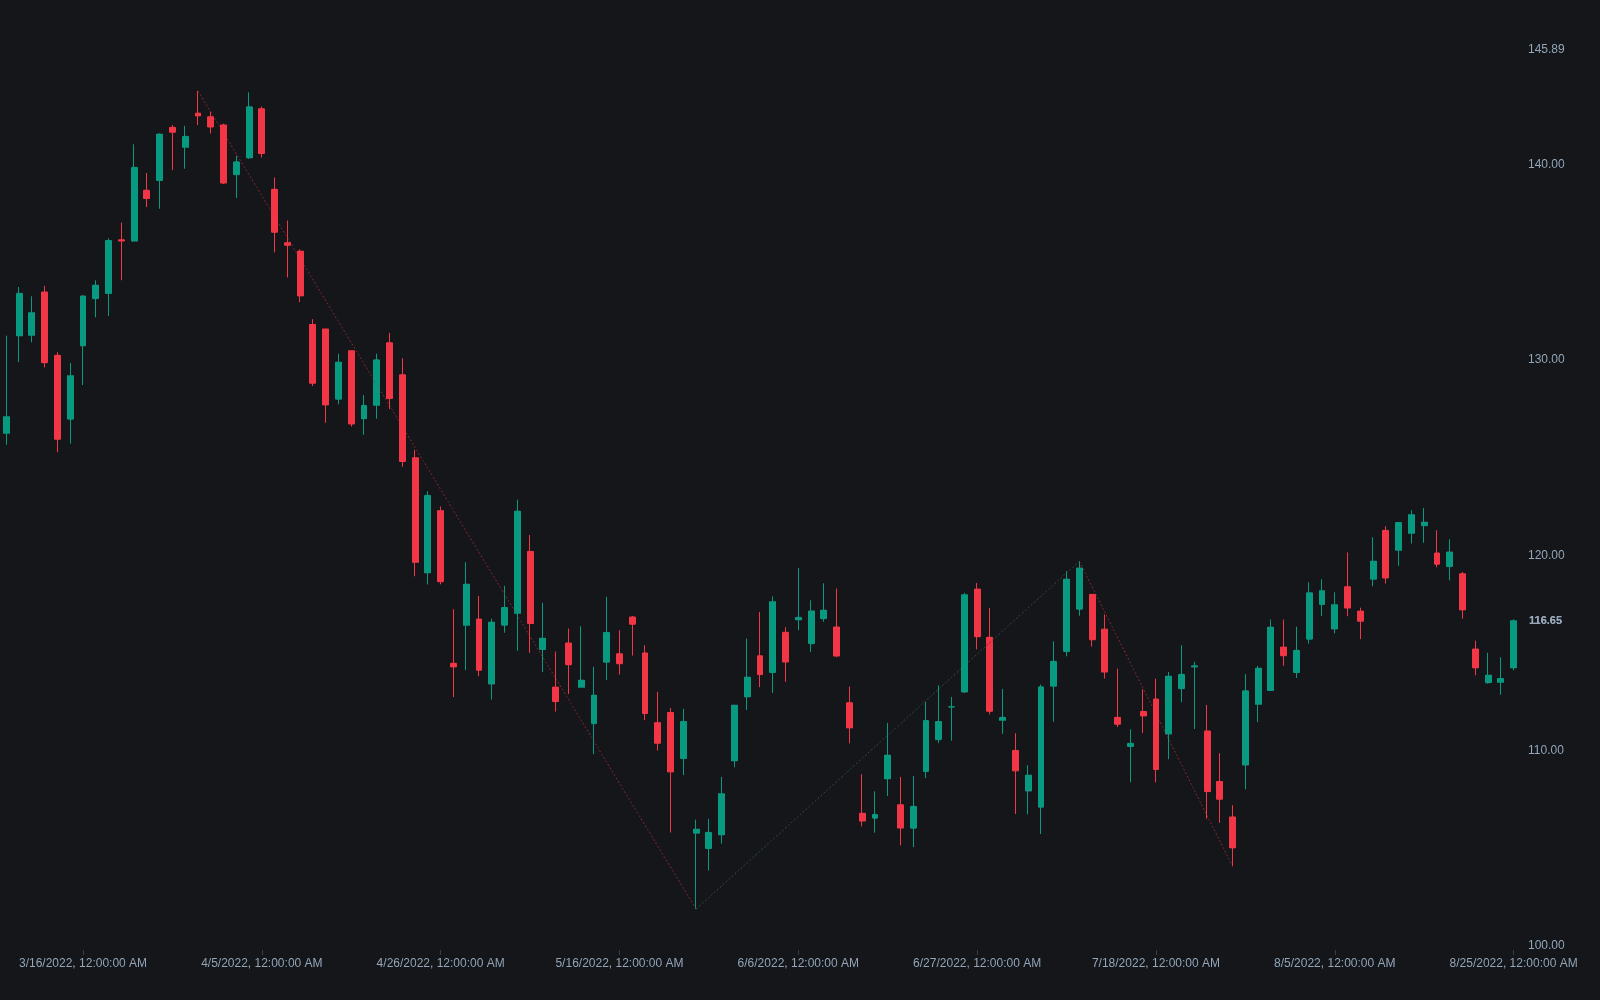
What is the Golden Pocket?
The golden pocket is the zone between the 0.618 and 0.65 levels of a Fibonacci retracement. The 0.618 comes from the golden ratio: ratios of consecutive Fibonacci numbers converge toward 1.618, and its inverse is 0.618, the classic deep-retracement level. The 0.65 boundary is a practical buffer that turns a single line into a tradable band. The term took hold in crypto trading and spread from there: draw a retracement across an impulse, and the pocket is the narrow slice at and just beyond the 61.8% level.
The vocabulary is young even if the level is not. The 61.8% retracement has anchored Fibonacci practice for decades; the pocket branding, with its fixed 0.65 upper edge, spread through crypto communities and trading content in the late 2010s and stuck because it solved a practical problem: a single ratio line is almost never touched exactly, while a defined band can be traded with rules.
The reading is trend-continuation: a pullback that holds the pocket keeps the prior leg's structure intact, while a decisive break below it pushes the retracement toward 0.786 and the swing origin, where the continuation premise weakens. It overlaps the shallow end of the optimal trade entry zone used in ICT-style models, which runs deeper into the retracement. Price does not owe the pocket a bounce; it is a location to look for evidence, not a signal by itself.
In practice the pocket is treated like any other candidate S/R zone: its standing rises with confluence and falls without it. A pocket that overlaps a prior consolidation shelf, a period open, or a mapped demand zone is a location two methods agree on; a pocket floating alone in space is one ratio's opinion. The measurement itself also matters: pockets drawn from ambiguous or minor swings inherit all the arbitrariness of their anchors.
How to identify the golden pocket on a chart
The long case in an uptrend is described; mirror for shorts in downtrends.
- 1Choose the impulse worth measuring: a clean, significant leg from swing low to swing high on the timeframe you trade.
- 2Draw the retracement from the leg's origin to its extreme, and mark the band between the 0.618 and 0.65 levels.
- 3Let price come to it: the setup exists only when a pullback actually trades into the band during a still-intact trend.
- 4Demand a trigger inside the zone: a rejection candle, a lower-timeframe structure shift, or absorption evidence, rather than a blind limit fill.
- 5Place invalidation past the 0.786 level or the measuring swing's origin, where the continuation thesis is objectively broken.
- 6Weigh confluence: overlap with a prior shelf, a prior period level, or a pivot-formula level upgrades the zone; isolation downgrades it.
How it's calculated
The golden pocket is the slice of a Fibonacci retracement between the 0.618 and 0.65 levels of the anchored swing.
Standard Fibonacci retracement math; the pocket is simply the named 0.618 to 0.65 slice, popularized in crypto trading.
Some traders use 0.66 or 0.666 as the outer bound.
It is a zone rather than a single line, and it moves with the chosen swing anchors.
How traders use it
- As a pullback entry zone: wait for price to trade into the pocket during an established trend, then require a trigger there (a rejection candle, a lower-timeframe structure shift) instead of resting blind limit orders.
- For stop framing: stops go beyond the pocket or beyond the 0.786 level, so the trade is invalidated by the same logic that justified it, a clean break of the zone.
- As a confluence anchor: a pocket that overlaps another independent level, such as a prior breakout point or a high-volume area, is treated as a stronger zone than the ratio alone.
- In multi-timeframe stacking: a weekly-leg pocket overlapping a daily-leg pocket marks one price where two horizons' pullback logic agrees, the Fibonacci-only case of general level clustering.
- As a target for counter-trend traders: those fading the impulse often aim the bounce or the correction at the pocket of the prior leg, using the same band from the other side of the trade.
Golden Pocket vs related level tools
Fib Retracement: The retracement tool draws the whole ratio grid across a swing; the pocket singles out one band of it, 0.618 to 0.65, as the high-interest slice. The pocket inherits everything from the drawn swing, including its anchor choices.
S/R Zone: An S/R zone earns its place from price memory: touches, reversals, congestion. The pocket is measured from a single swing's proportions and can sit where price has never reversed. When the two coincide, the level has both history and geometry behind it.
Fibonacci Pivots: Fibonacci pivots put the same ratios through a fixed formula on the prior period's range, identical for everyone. The pocket is drawn from a chosen swing, so it carries more analyst judgment, for better and worse.
Concept family
Support/Resistance & Levels
38 concepts mapped · 38 in the Library
Golden Pocket FAQ
Turn Golden Pocket into a trading strategy.
Take the implementation from this page into Quant, then build on it, backtest it on real data, and keep refining it in conversation.