Concept
V-top/V-bottom
V-top/V-bottom, also known as spike reversal, is a Chart & Candlestick Patterns concept. The Library holds 1 implementation, a working definition you can pull into Quant.
Top V-top/V-bottom indicator
The top custom implementation, built on the original standard V-top/V-bottom formula.
1 total
This V-top/V-bottom implementation is strategy-ready: open it in Quant, set your rules, and it backtests automatically.
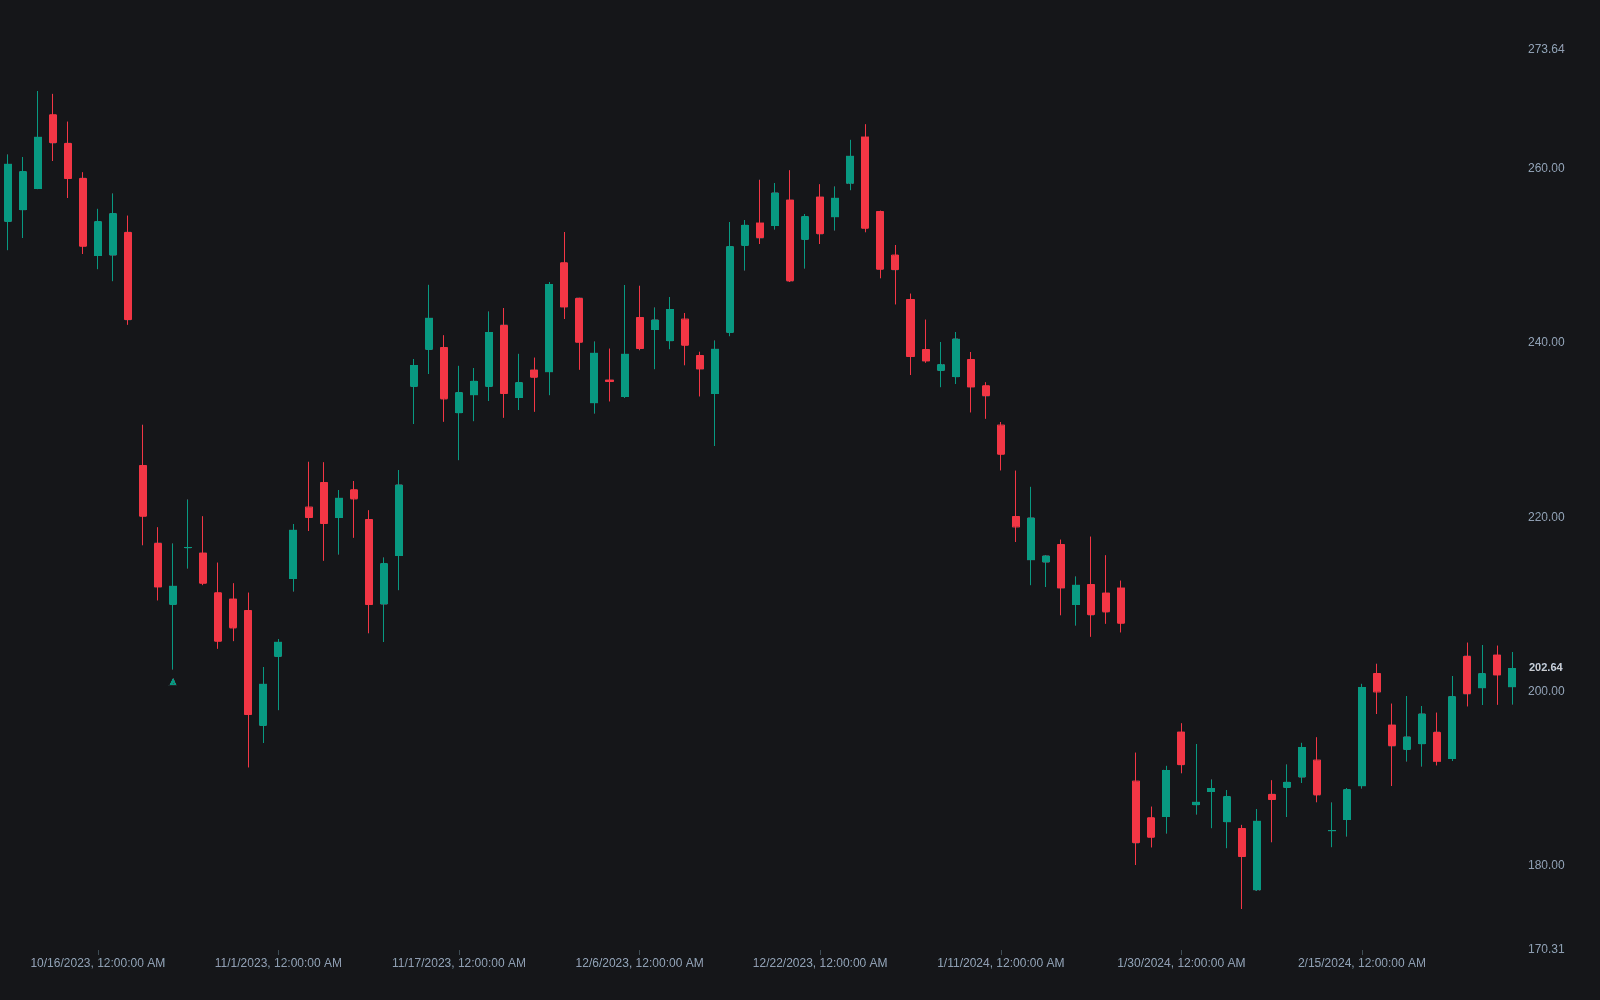
What are V-Tops and V-Bottoms?
A V-top is a reversal with no top-building phase at all: a steep advance ends abruptly and turns into a steep decline, leaving a single sharp apex on the chart. The V-bottom mirrors it, a waterfall decline that reverses into an equally fast recovery. Traders also call these spike reversals, and the classical literature files them among the most treacherous formations precisely because they offer none of the structure that other reversals provide.
Most reversal patterns describe a transfer of positions over time: tops distribute, bottoms accumulate, and the pattern's boundaries give the trader reference points. The V-shape skips that process. It typically arises from a shock, such as a news event, a forced liquidation, or a climactic move that exhausts one side in hours rather than weeks. The signature is a violent final leg, often accompanied by extreme volume and range, followed by a reversal that retraces the leg at comparable speed.
Traders care about V-reversals for two reasons that pull in opposite directions. They frequently mark the exact extreme of a move, so catching one can be enormously profitable. But because there is no neckline, boundary, or second test to lean on, they are nearly impossible to trade on structure alone, and most practical methods rely on exhaustion evidence at the extreme rather than the shape itself, which only exists in hindsight.
How to identify a V-top or V-bottom
The full V is a hindsight object; real-time identification is really the search for exhaustion at the tip.
- 1Require an accelerating prior move: V-reversals grow out of steep, often parabolic legs, not quiet drifts.
- 2Look for climax evidence at the extreme: a volume spike, an unusually wide-range bar, or a gap that immediately fails.
- 3Watch for a discrete reversal event at the tip, such as a key reversal bar, an exhaustion bar, or an island left by twin gaps.
- 4Confirm with speed on the other side: the return leg should retrace the final leg quickly and with breadth, not stall into a range.
- 5Treat broken levels from the final leg as the working references, since the pattern itself supplies no boundaries.
- 6Be suspicious of the label whenever the reversal pauses and builds structure; that is a different, more tradable pattern.
How traders use it
- Exhaustion entries at the tip: rather than trading the V (which is only visible afterward), traders act on the climax evidence, entering against the spike with a stop beyond the extreme bar; the win rate is modest and the stop is non-negotiable.
- Riding the recovery: a common compromise is to skip the tip and enter on the first pullback after the reversal leg proves itself, accepting a worse price for confirmation that the V is real.
- Exit discipline for trend riders: holders of positions in an accelerating move use climax signatures to take profit, since V-reversals tend to return gains to the market faster than most other topping processes.
- Honest limitation: most spikes do not reverse into Vs, and fading strength on exhaustion evidence alone has a high failure rate; survivorship makes remembered V-bottoms look more catchable than they were.
V-reversals vs. other sharp turns
Island reversal: An island reversal isolates the extreme between two gaps, giving a concrete invalidation level; a V-reversal may contain an island but often turns without any gap at all.
Key reversal: The key reversal is a single-bar event that often forms the tip of a V; the V-top/V-bottom describes the full shape of the move on both sides of that bar.
Rounding top/bottom: The rounding turn is the V's opposite: a gradual, low-drama transfer of control over many bars, with correspondingly gentler follow-through.
Concept family
Chart & Candlestick Patterns
84 concepts mapped · 84 in the Library
V-top/V-bottom FAQ
Turn V-top/V-bottom into a trading strategy.
Take the implementation from this page into Quant, then build on it, backtest it on real data, and keep refining it in conversation.