Concept
Fib Extension
Fib Extension is a Support/Resistance & Levels concept. The Library holds 3 implementations, each one a working definition you can pull into Quant.
Top Fib Extension indicators
The top custom implementations, built on the original standard Fib Extension formula.
3 total
Every Fib Extension implementation here is strategy-ready: open one in Quant, set your rules, and it backtests automatically.
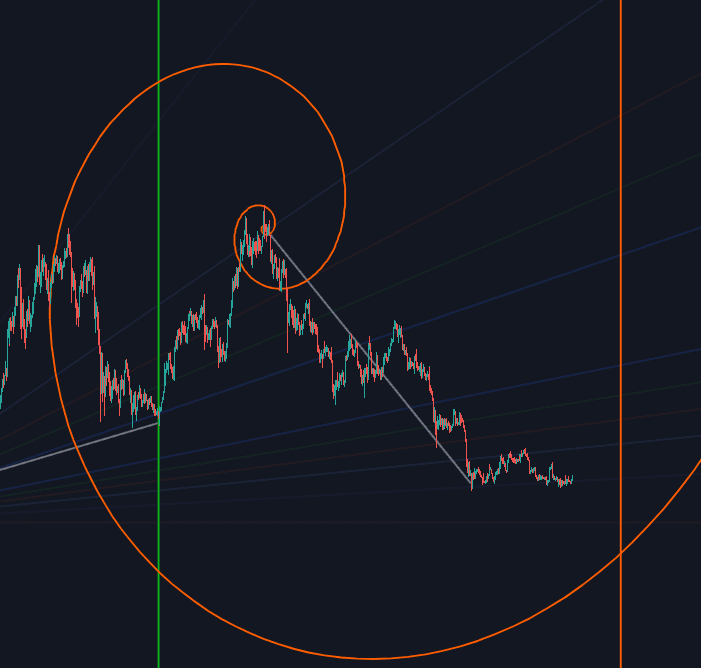
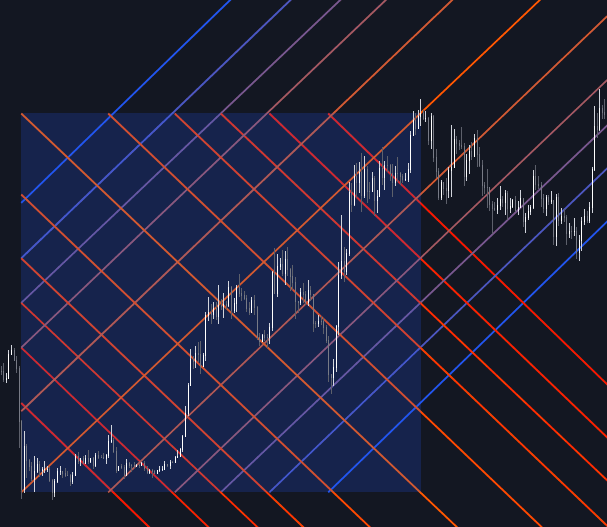
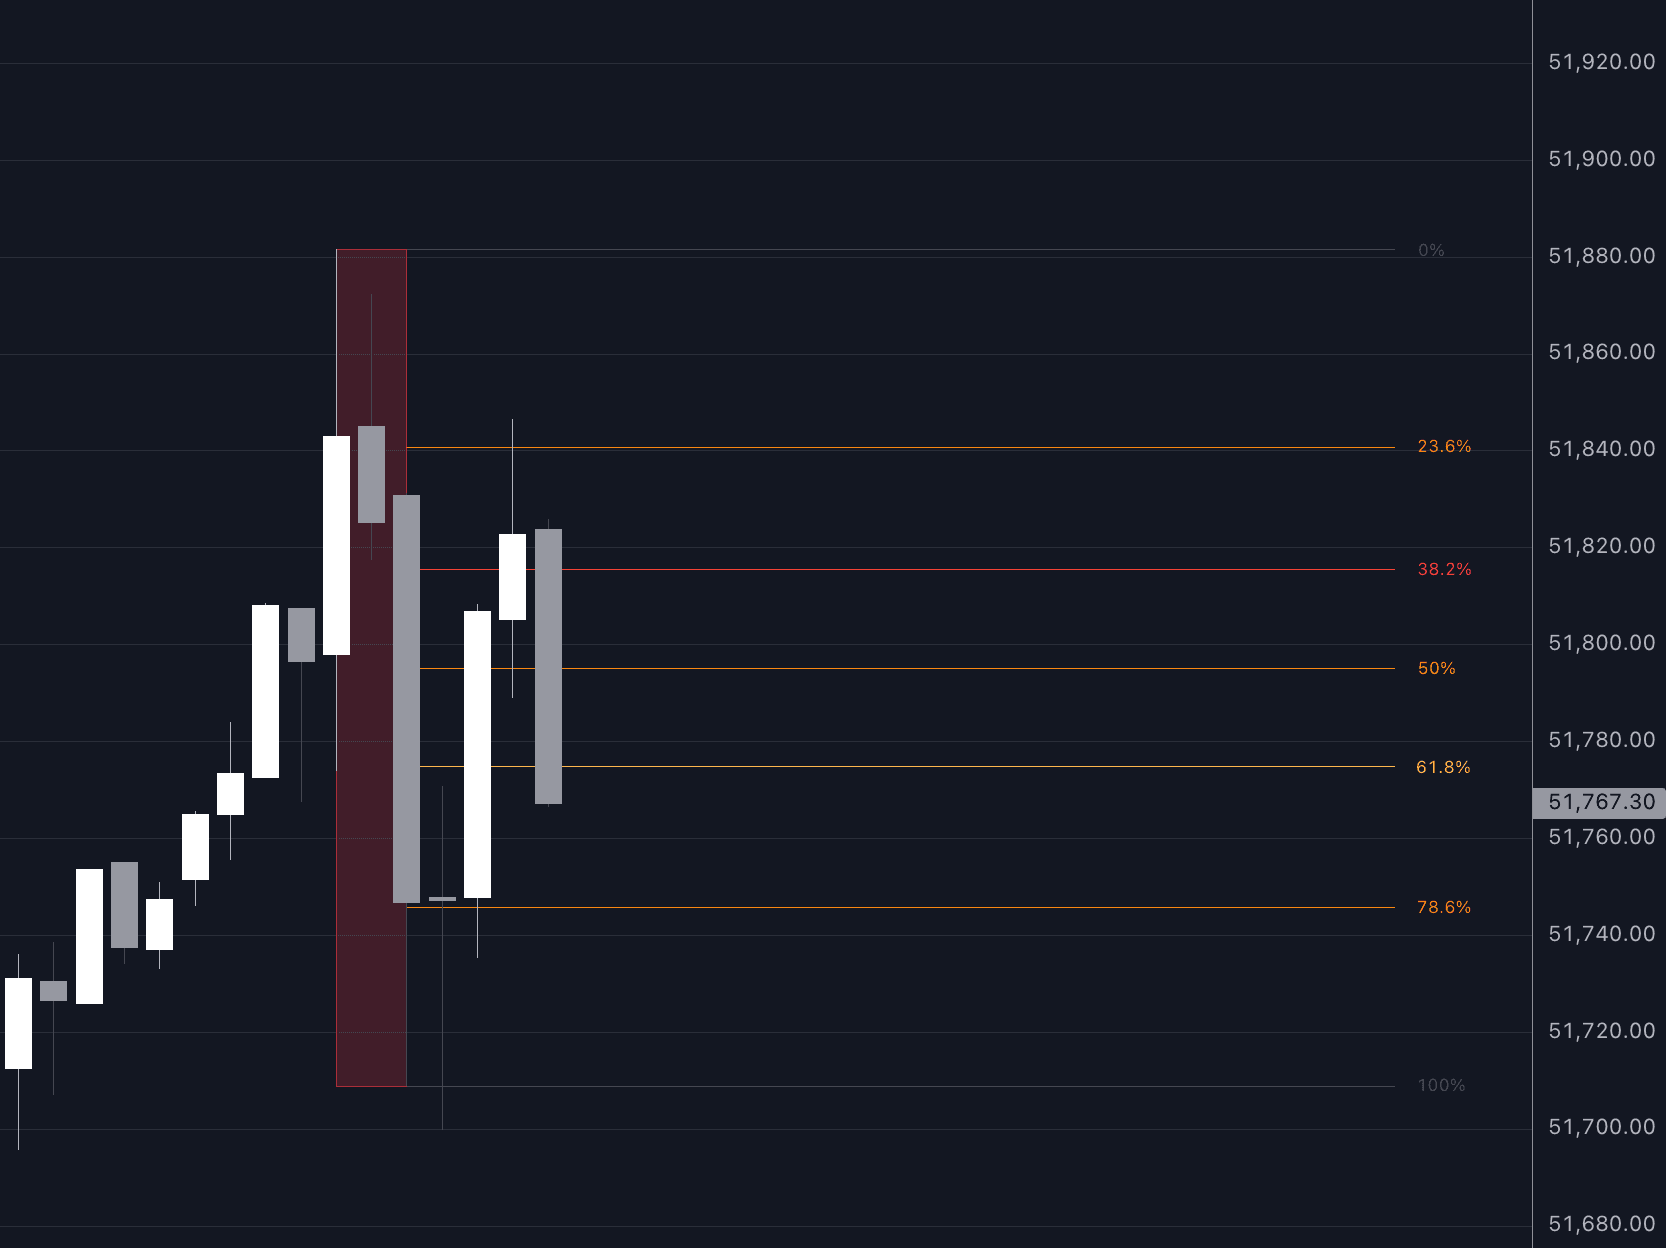
What is a Fib Extension?
A fib extension projects Fibonacci-ratio levels beyond the end of a measured swing. Anchored to a swing low and a swing high, the tool treats that distance as 100% and marks levels past it, most commonly 1.272, 1.618, 2, and 2.618. Where a fib retracement asks how far a pullback might travel inside the swing, an extension asks where price might reach once it breaks beyond the swing's extreme.
The ratios come from the Fibonacci sequence, where the ratio between successive terms converges on the golden ratio of about 1.618; 1.272 is the golden ratio's square root and 2.618 its square. Terminology varies by platform: some reserve 'extension' for the two-point tool that reads ratios beyond 100% of one swing and call the three-point construction a trend-based extension or fib projection, so it is worth checking how many anchors your tool expects. Extensions earn their keep where history offers nothing overhead: in price discovery past an old high there are no prior levels to lean on, and ratio projections are one of the few ways to place targets at all. They are reference points, not stopping guarantees.
How to draw a Fib Extension
Most platforms draw the two-point version from the same anchors as a retracement; the difference is which levels you read.
- 1Anchor the tool to a clear swing: low to high for upside targets, high to low for downside ones. Choose meaningful swing highs and lows, not minor wiggles, because every level scales off this distance.
- 2Read the levels beyond 100% of the swing. Common choices are 1.272, 1.618, 2, and 2.618; some tools add 1.414 or deeper ratios such as 3.618 and 4.236.
- 3Wait for the swing extreme to actually break. Extension levels are dormant until the 100% point gives way; before that, retracement levels inside the swing are the relevant map.
- 4Judge each level by the reaction it gets: stalls, long wicks, or fading momentum into the level carry more information than the touch itself.
How it's calculated
Levels beyond the end of a completed swing, at Fibonacci multiples of that swing's height, used as continuation targets.
The ratios derive from the golden ratio 1.618: 1.272 = sqrt(1.618) and 2.618 = 1.618 × 1.618.
A second convention measures extensions past the swing origin as retracements deeper than 100%, for example B - 1.272 × (B - A).
Three point tools labeled trend based Fib extension on some platforms are the projection covered under Fib Projection.
How traders use it
- As breakout targets: once price clears the anchored swing's extreme, 1.272 and 1.618 are common first and second objectives for taking profit in stages.
- In price discovery: at all-time highs there is no overhead structure left, so extensions of the last major swing supply candidate resistance where nothing else exists.
- For confluence: an extension that lands on a prior level, a round number, or another tool's projection forms a fib cluster, and clustered levels are generally treated as stronger than isolated ones.
- As exhaustion flags: deep extensions such as 2.618 and beyond are commonly read as stretched territory, where trend chasers turn cautious and reversal watchers start paying attention.
Fib Extension vs other Fibonacci tools
Fib Retracement: A retracement reads levels inside the anchored swing, 23.6% to 78.6%, to locate pullback support or resistance. An extension reads levels beyond 100% to locate targets once the swing extreme breaks.
Fib Projection: A projection is the three-point tool: it measures swing A to B and transfers ratios of that distance from a separate anchor C. The two-point extension scales one swing past its own extreme. Platforms blur the names, so check the anchor count.
Fib Clusters: A cluster is the confluence zone that forms when several Fibonacci measurements land near the same price. An extension is a single tool's output and one possible input into such a zone.
Concept family
Support/Resistance & Levels
38 concepts mapped · 38 in the Library
Fib Extension FAQ
Turn Fib Extension into a trading strategy.
Take any implementation from this page into Quant, then build on it, backtest it on real data, and keep refining it in conversation.