Concept
Session & Weekly Profiles
Session & Weekly Profiles, also known as London/NY reversal profiles, daily bias models, weekly templates, are Smart Money Concepts / ICT concepts. The Library holds 1 implementation, a working definition you can pull into Quant.
Top Session & Weekly Profiles indicator
The top custom implementation, built on the original standard Session & Weekly Profiles formula.
1 total
This Session & Weekly Profiles implementation is strategy-ready: open it in Quant, set your rules, and it backtests automatically.
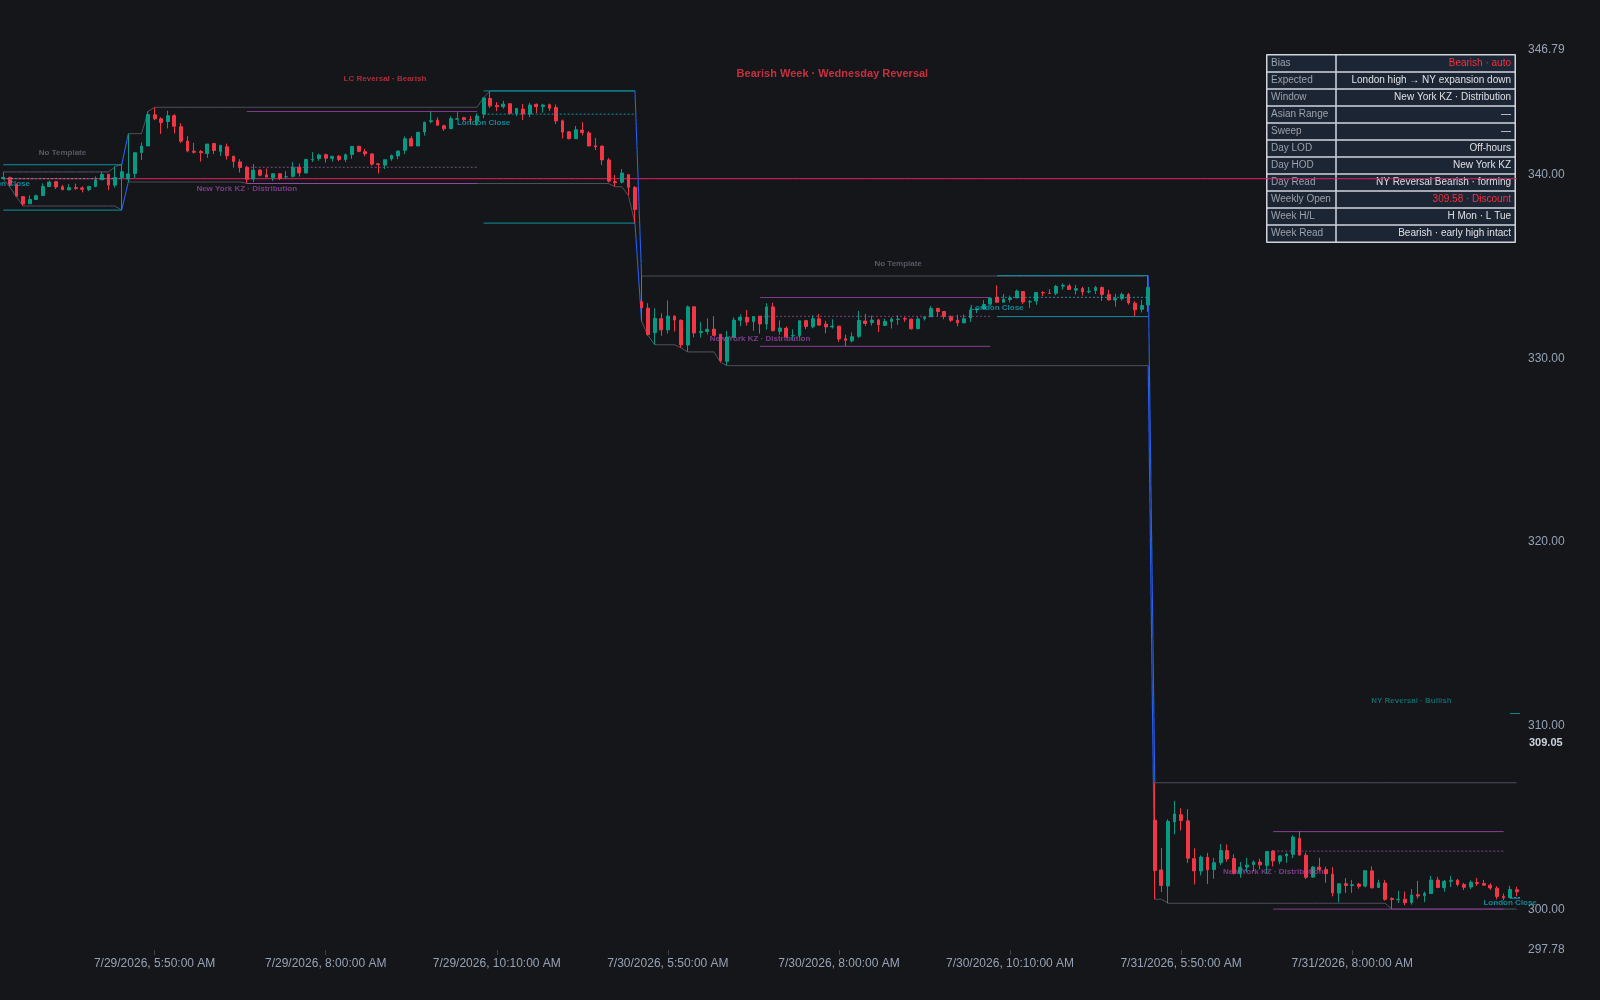
What are Session & Weekly Profiles?
Session and weekly profiles are recurring templates for how a trading day or week tends to unfold against the session clock. In the ICT framework the day is partitioned into the Asian, London, and New York trading sessions, and a profile names a typical shape across them: in a classic bullish day, Asia consolidates, London runs the sell stops below the Asian range to put in the low of day (the Judas swing), and New York delivers the trend. London and New York reversal profiles invert parts of that script. Weekly profiles apply the same idea one scale up: most familiarly the template in which a bullish week forms its low early, often Monday through Wednesday, before expanding.
Profiles are the bridge between time and direction, the working material of daily-bias models. The trader first forms a bias from higher-timeframe structure and the current draw on liquidity, then selects the profile that would deliver it: which session should produce the day's extreme, which should trend, and where session liquidity should be taken before the move begins. The honest framing is that these are prototypes, not schedules. Sessions structure participation (liquidity concentrates at opens and inside killzones), which is why day shapes rhyme, but no template plays out on demand, and a day that fits no profile is itself information: stand-aside conditions rather than a broken rule.
How to map session profiles on an intraday chart
Profiles only become useful once you can watch them form in real time, and that starts with putting the session clock on the chart.
- 1Shade the Asian, London, and New York sessions on a 5–15 minute chart (New York time is the usual reference) and mark the Asian range high and low.
- 2Watch the London window for a run through one side of the Asian range; a sweep that reverses quickly is the manipulation leg most bullish and bearish templates begin with.
- 3Track where the day's actual extreme forms: a London low followed by expansion through New York fits the classic trend template, while New York undoing London's move fits a reversal profile.
- 4Review a few weeks of days this way. Profiles are tendencies, so the goal is learning which shapes your market actually produces, not forcing every day into a template.
How it's calculated
Session and weekly profiles are template maps of where within the trading day or week the high and low are expected to form for a given directional bias.
These are discretionary templates popularized by ICT, with no single numeric output; the classification is only certain after the day or week completes.
Session boundaries vary by instrument and platform and shift with daylight saving.
Commonly cited weekly templates include the classic Tuesday low or high, the Wednesday midweek reversal, and the consolidation Thursday reversal.
How traders use it
- To convert a bias into a plan: with a long bias, the trader expects the day's low during a specific window, waits for the stop run below the prior session's range, and only then hunts entries in the bias direction.
- To time reversals: London and New York reversal profiles say where a trend from the prior session is most likely to be cut short, so fades are taken only inside those windows instead of counter-trending all day.
- To frame the week: weekly templates set expectations for which weekday is likely to print the weekly high or low, informing whether to take a swing entry early or wait for mid-week, alongside broader day-of-week tendencies.
- To recognize no-trade days: when each session takes the previous session's extreme and reverses, the day matches the choppy seek-and-destroy shape, and most profile traders cut size or stand aside.
Session & weekly profiles vs related timing concepts
Killzones: Killzones are the time windows themselves, fixed slots on the session clock. A profile is the shape expected to form across those windows: which one makes the extreme, which one trends.
Trading Sessions: Sessions are the raw partition of the 24-hour day by market hours. Profiles are behavioral templates layered on that partition; they assume the session structure and add a directional script.
Accumulation-manipulation-distribution: AMD, the 'power of three', is the abstract phase sequence: build, run stops, deliver. A session profile pins those phases to particular sessions, so it is AMD written onto the clock.
Concept family
Smart Money Concepts / ICT
54 concepts mapped · 54 in the Library
Session & Weekly Profiles FAQ
Turn Session & Weekly Profiles into a trading strategy.
Take the implementation from this page into Quant, then build on it, backtest it on real data, and keep refining it in conversation.