Concept
Standard-deviation Projections
Standard-deviation Projections are Smart Money Concepts / ICT concepts. The Library holds 2 implementations, each one a working definition you can pull into Quant.
CBDR/flout STDVs
Top Standard-deviation Projections indicators
The top custom implementations, built on the original standard Standard-deviation Projections formula.
2 total
Any of the 2 Standard-deviation Projections implementations below can become a backtested trading strategy — describe your rules and Quant writes the code.
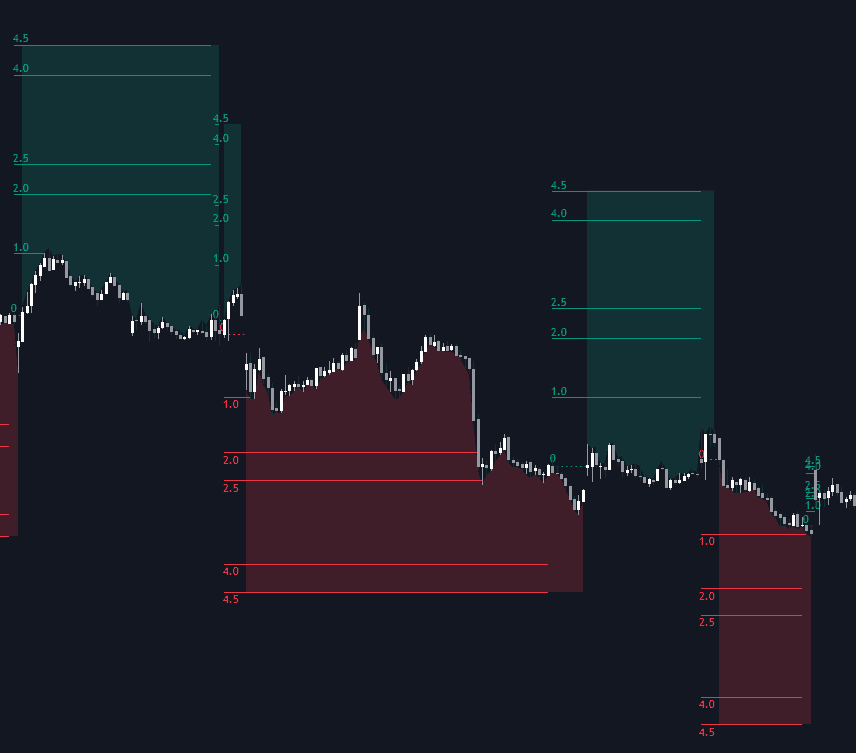
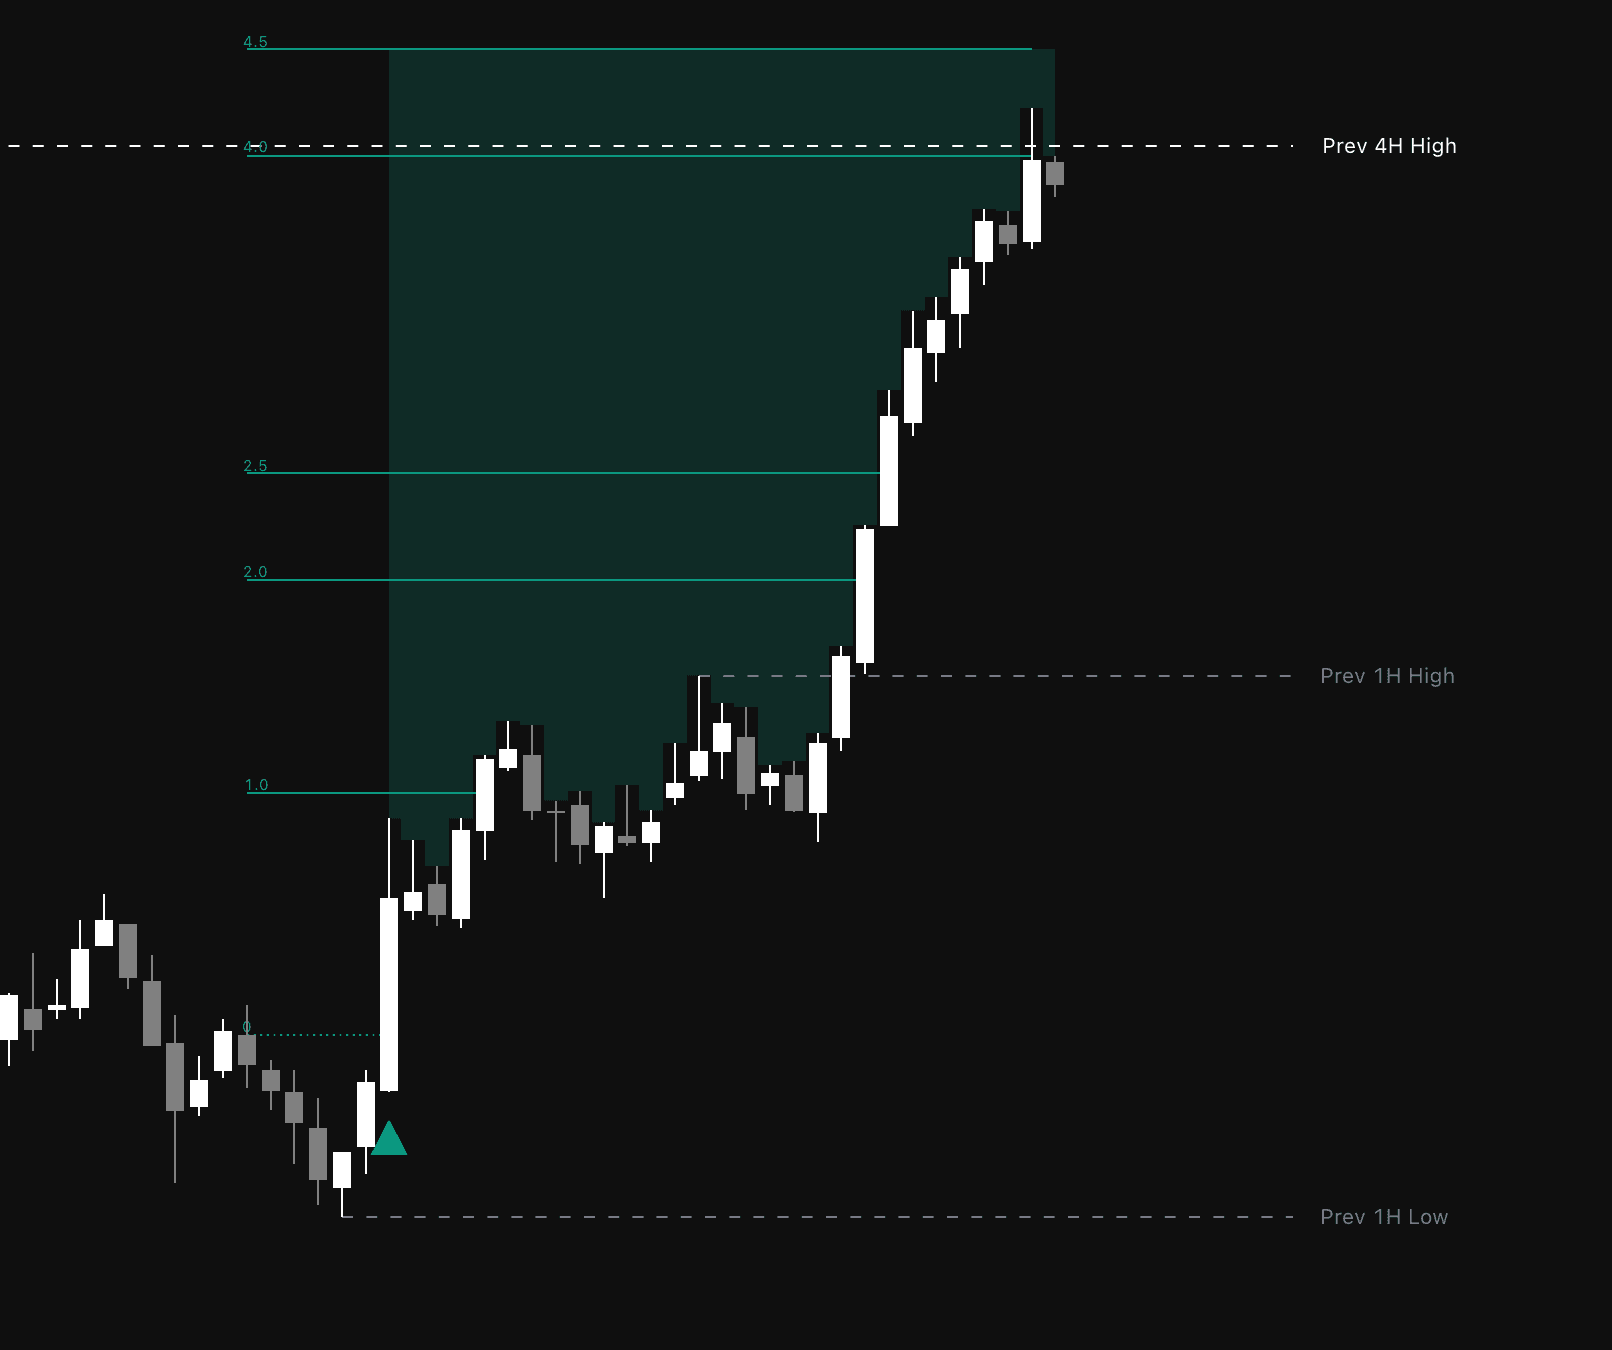
What are Standard-deviation Projections?
Standard-deviation projections extend the height of a completed range in multiples above and below it, mapping where a later expansion might reach. Despite the name, nothing statistical is computed: in ICT usage one "standard deviation" equals the height of the anchor range, laddered outward in whole and half multiples (±1, ±2, ±2.5, up to ±4 in common practice). The classic anchor is a defining range from the quiet part of the forex day: the Central Bank Dealers Range (CBDR) formed in the New York afternoon-to-evening lull, the Asian range, or the "flout", a related range from the early forex material.
The technique traces to the teaching of Michael Huddleston, the Inner Circle Trader (ICT), whose early forex material projected the CBDR and Asian range to estimate where the next day's high or low might form. The underlying idea is older measured-move logic, a consolidation's height setting the yardstick for the expansion that leaves it; the ICT ladder formalizes that yardstick into fixed multiples.
The premise is that expansion out of consolidation tends to travel a measured multiple of that consolidation, so the bands act as candidate zones for the coming session's high or low. Newer applications anchor the ladder to an opening range or to the manipulation leg of a session (the Judas swing) and project in the direction of the expected expansion. Either way the bands are map lines, not confidence intervals, and are normally read with structure rather than traded on contact.
The appeal is a pre-drawn session map. Within the accumulation-manipulation-distribution template, projections of the manipulation leg estimate where distribution might exhaust, which is where the day's extreme is hunted. And because the anchor ranges repeat at fixed clock times inside killzones, the ladder pairs naturally with ICT session ranges: the same few windows supply the anchor each day.
How to draw standard-deviation projections on a chart
The ladder takes a minute to build once the anchor range is chosen.
- 1Choose the anchor: the CBDR, the Asian range, an opening range, or the manipulation leg of the current session.
- 2Mark the anchor's high and low and measure its height; that height is one "standard deviation" in this method.
- 3Project multiples of that height above and below the range, commonly the whole and half steps out to ±4, using a Fibonacci tool set to those levels or a dedicated script.
- 4For directional anchors such as a manipulation leg, set 0 at the leg's origin and 1 at its end, so the negative multiples extend beyond the swing in the expansion direction.
- 5Note which rungs coincide with independent levels, such as prior highs or lows holding session liquidity or an untouched fair value gap; confluent rungs carry the most weight.
How it's calculated
Price targets projected beyond a reference range in multiples of that range's own height.
Despite the name no statistical variance is involved; one deviation equals the height R of the reference range or leg.
Common ICT anchors are the Asian range, the Central Bank Dealer Range and a manipulation leg, often drawn with a Fibonacci tool as negative extensions (-1, -1.5, -2, -2.5, -4).
When the reference is a directional leg, only the levels on the expected expansion side are used.
How traders use it
- As session-extreme framing (the classic use): project the CBDR or Asian-range ladder before London opens and treat the outer bands as zones where the day's high or low may form. A quiet day that never reaches the first band is information too.
- As post-manipulation targets: anchor the ladder to the leg that ran the liquidity, then project deviations in the expansion direction as scale-out zones. The commonly watched multiples (−2, −2.5, −4) are convention within the methodology, not measured probabilities.
- As a confluence filter: a band that lands on a higher-timeframe level, deep in premium or discount of the working range, or on an order block is treated as far more interesting than one floating in isolation.
- As a reversal-hunting frame: a liquidity sweep that terminates into an outer rung pairs a run on a liquidity pool with a completed projection; many traders then wait for an optimal trade entry retracement once price turns.
- As pre-defined trade management: the rungs are fixed once the anchor completes, giving objective session targets and keeping management mechanical rather than improvised.
Standard-deviation projections vs. related ICT tools
ICT Session Ranges: Session ranges mark each trading window's high and low; projections take one completed range and extend its height outward, turning a static range into a forward map.
Killzones: Killzones say when expansion is likely; projections estimate how far it might carry. An outer rung reached inside a killzone is the higher-interest version of either signal alone.
ICT Time Anchors: Time anchors fix the clock moments (midnight open, session opens) that start and end the anchor ranges; the projection ladder is one of the tools hung off those times.
Concept family
Smart Money Concepts / ICT
54 concepts mapped · 54 in the Library
Standard-deviation Projections FAQ
Turn Standard-deviation Projections into a trading strategy.
Take any implementation from this page into Quant, then build on it, backtest it on real data, and keep refining it in conversation.