Concept
Institutional Order Flow
Institutional Order Flow is a Smart Money Concepts / ICT concept. The Library holds 1 implementation, a working definition you can pull into Quant.
Top Institutional Order Flow indicator
The top custom implementation, built on the original standard Institutional Order Flow formula.
1 total
From studying Institutional Order Flow to trading it: take the implementation below into Quant and backtest it instantly.
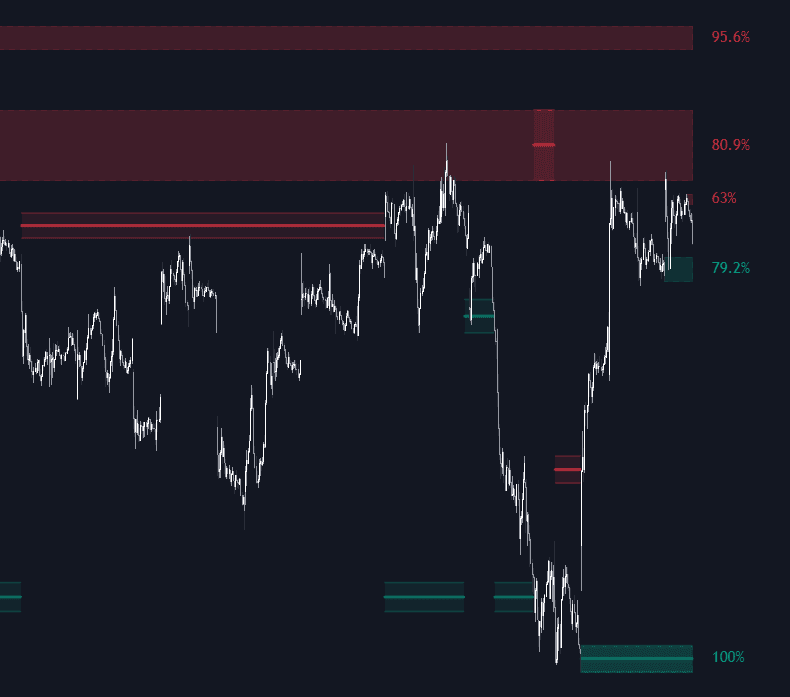
What is Institutional Order Flow?
Institutional order flow is the ICT term for the market's prevailing direction of delivery: the sustained directional pressure attributed to large participants, inferred entirely from price behavior. The tell is asymmetry: in bullish institutional order flow, price keeps reaching for old highs, and pullbacks into down-closing candles or bullish PD arrays (order blocks, fair value gaps) get bought; in bearish flow, old lows keep getting taken and up-closing candles act as resistance. It is a read on which side's zones are being respected and which side's are being run over.
The name collides with a different discipline, and the collision matters. Order flow in the microstructure sense means measured transaction data: executed volume at bid versus ask, depth of market, footprint charts. Institutional order flow in the SMC/ICT sense uses none of that: it is a price-action inference, not a data feed, and no retail chart reveals whose orders sit behind a move. Read it as the framework's bias layer (the direction setups are required to agree with) and treat the word 'institutional' as the model's interpretation rather than something observable.
How to read institutional order flow
The read is done top-down (higher timeframe first) and re-checked as each new swing forms.
- 1Track which liquidity is being taken: a market repeatedly trading through old highs while leaving old lows intact is being delivered higher; the draw on liquidity sits above. The mirror reads bearish.
- 2Watch how pullbacks behave: in bullish flow, retracements into down-closing candles and bullish arrays hold and reverse. When those zones start failing on retests, the flow is in question.
- 3Compare the legs: with-flow moves tend to be one-sided and energetic (displacement), while counter-flow moves stay overlapping and corrective. When that asymmetry inverts, the flow may be turning.
- 4Reassess at liquidity events: a run through a major pool that fails to continue is the classic place delivery changes hands; a change in state of delivery is the confirming behavior to watch for.
How traders use it
- As the bias filter of the model: setups are taken in the direction of higher-timeframe flow, and counter-flow signals are skipped or downgraded no matter how clean they look locally.
- As a target selector: bullish flow implies the objective is the buy-side liquidity overhead (old highs, equal highs), which frames where to hold runners and where the move's job is likely done.
- As an early-warning system: the first bullish array that fails on a retest, after a long streak of holding, is often the earliest evidence of a smart money reversal forming.
- As a tiebreaker between timeframes: when the entry timeframe is ambiguous, a common convention is to defer to the flow one or two timeframes up rather than average the two reads.
Institutional order flow vs nearby concepts
Volume Delta: Measured order flow: the actual imbalance of executed buys versus sells from exchange data. Institutional order flow is inferred from price structure alone; the two answer related questions from entirely different evidence, and they can disagree.
Displacement: Displacement is a single energetic leg, one burst of one-sided delivery. Institutional order flow is the regime those legs add up to: repeated displacement in one direction while the opposing moves stay corrective.
Draw on Liquidity: The draw is the destination: the specific pool price is reaching for. Institutional order flow is the directional condition that makes that pool the target: flow sets the direction, the draw names the objective.
Concept family
Smart Money Concepts / ICT
54 concepts mapped · 54 in the Library
Institutional Order Flow FAQ
Turn Institutional Order Flow into a trading strategy.
Take the implementation from this page into Quant, then build on it, backtest it on real data, and keep refining it in conversation.