Concept
Trendline Liquidity
Trendline Liquidity is a Smart Money Concepts / ICT concept. The Library holds 1 implementation, a working definition you can pull into Quant.
Top Trendline Liquidity indicator
The top custom implementation, built on the original standard Trendline Liquidity formula.
1 total
Want to trade Trendline Liquidity? The implementation below is one prompt away from a backtested strategy in Quant.
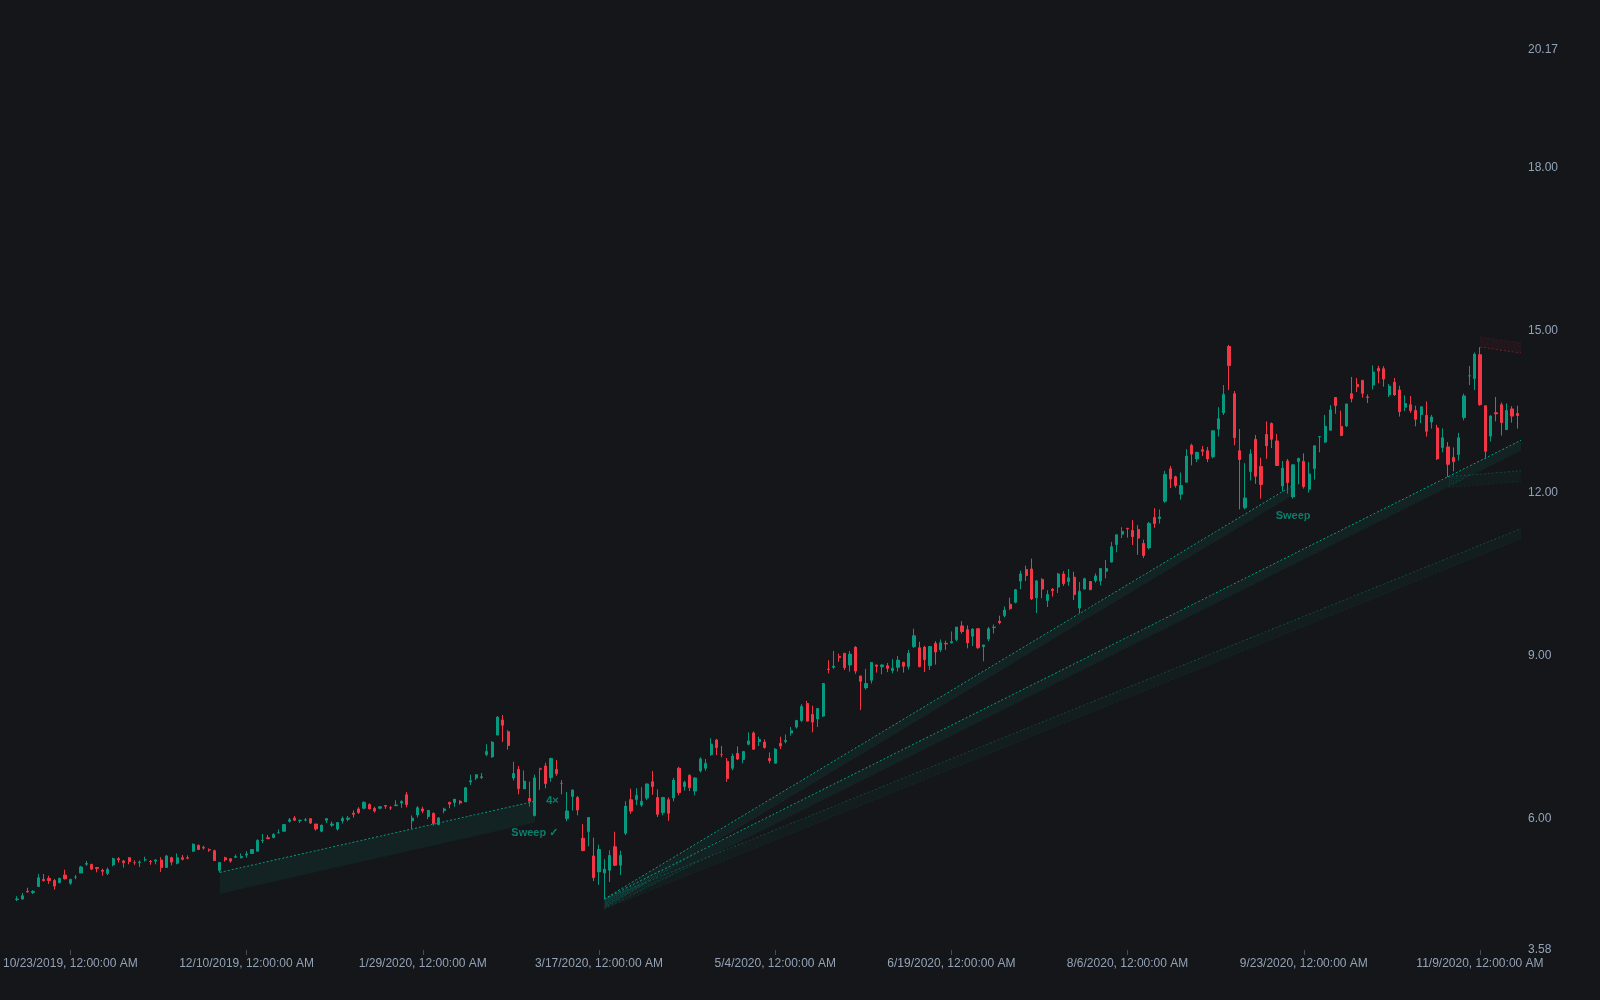
What is trendline liquidity?
Trendline liquidity is the pool of resting orders that accumulates around a widely drawn trendline. Because trendlines are among the most popular tools in retail technical analysis, a clean, repeatedly touched line tends to attract predictable order flow: traders buying each touch of a rising support line commonly place stops just below it, and breakout traders place sell entries below the same line. The result is often a diagonal band of sell-side orders under a rising trendline, and the mirror image above a falling one, forming a diagonal liquidity pool rather than the horizontal pools formed by equal highs and lows.
The concept, emphasized in Smart Money Concepts and Inner Circle Trader (ICT) teaching, reframes the trendline from a barrier into a target. In this reading, the more obvious and more respected a trendline becomes, the more valuable it is to break, because the stops and pending orders stacked along it provide the counterparty volume a large participant needs. A frequent expression of this is the fake trendline break: price pierces the line, fills against the resting orders, and reverses, leaving breakout traders trapped in what is effectively a diagonal false breakout.
Traders care because the idea inverts a common habit. Instead of joining the third touch of a textbook trendline, liquidity-focused traders ask who is positioned along that line and where their stops sit, then watch for the sweep of those orders as a potential entry in the opposite direction of the break.
How to identify trendline liquidity on a chart
The liquidity is proportional to how obvious the line is, so look for the trendlines everyone else is drawing.
- 1Find a clean line with three or more respected touches on a widely watched timeframe; obscure lines on odd timeframes attract little order flow.
- 2Infer the resting orders: below a rising support line sit stops from trendline buyers plus breakout sell orders, forming a diagonal band of sell-side interest.
- 3Note that each successive touch adds participants, so a mature, frequently touched line typically carries more liquidity than a fresh two-touch line.
- 4Watch the break itself: a sharp poke through the line that stalls quickly and reclaims it suggests a sweep of trendline liquidity rather than a genuine trend change.
- 5Confirm with what follows: displacement back through the line and a structural shift in the sweep's direction distinguish a completed sweep from an actual breakdown.
How traders use it
- As a reversal setup: traders wait for the trendline to be broken, watch the move fail, and enter on the reclaim, targeting the opposite side of the recent range with stops beyond the sweep's extreme.
- As a stop-placement guide: traders who do buy trendline touches place stops well beyond the obvious band just under the line, accepting worse risk-reward to avoid the most crowded stop pocket.
- As a filter on breakout trades: knowing that obvious trendline breaks frequently sweep and reverse, breakout traders demand follow-through, such as acceptance beyond the line and a retest, before trusting the move.
- As part of a liquidity map: trendline liquidity is weighed alongside horizontal pools to judge which side of the market offers the larger draw. The honest caveat is that many trendline breaks are real, and no reliable rule identifies in advance which break is a sweep.
Trendline liquidity vs adjacent liquidity concepts
Equal highs and lows as liquidity: Equal highs and lows form horizontal pools at a fixed price. Trendline liquidity is diagonal: the pool migrates with each new touch, so the sweep level depends on when the break occurs, not just where.
Inducement: Inducement is the general concept of engineered order flow that entices traders into positions whose stops become fuel. An obvious trendline is one of the most common inducement structures, since every touch recruits new participants.
False breakout: A false breakout describes the failed break from the pattern trader's perspective. Trendline liquidity offers the mechanism: the break succeeded at its actual job of filling orders against the stops beneath the line.
Concept family
Smart Money Concepts / ICT
54 concepts mapped · 54 in the Library
Trendline Liquidity FAQ
Turn Trendline Liquidity into a trading strategy.
Take the implementation from this page into Quant, then build on it, backtest it on real data, and keep refining it in conversation.