Concept
Market Maker Models
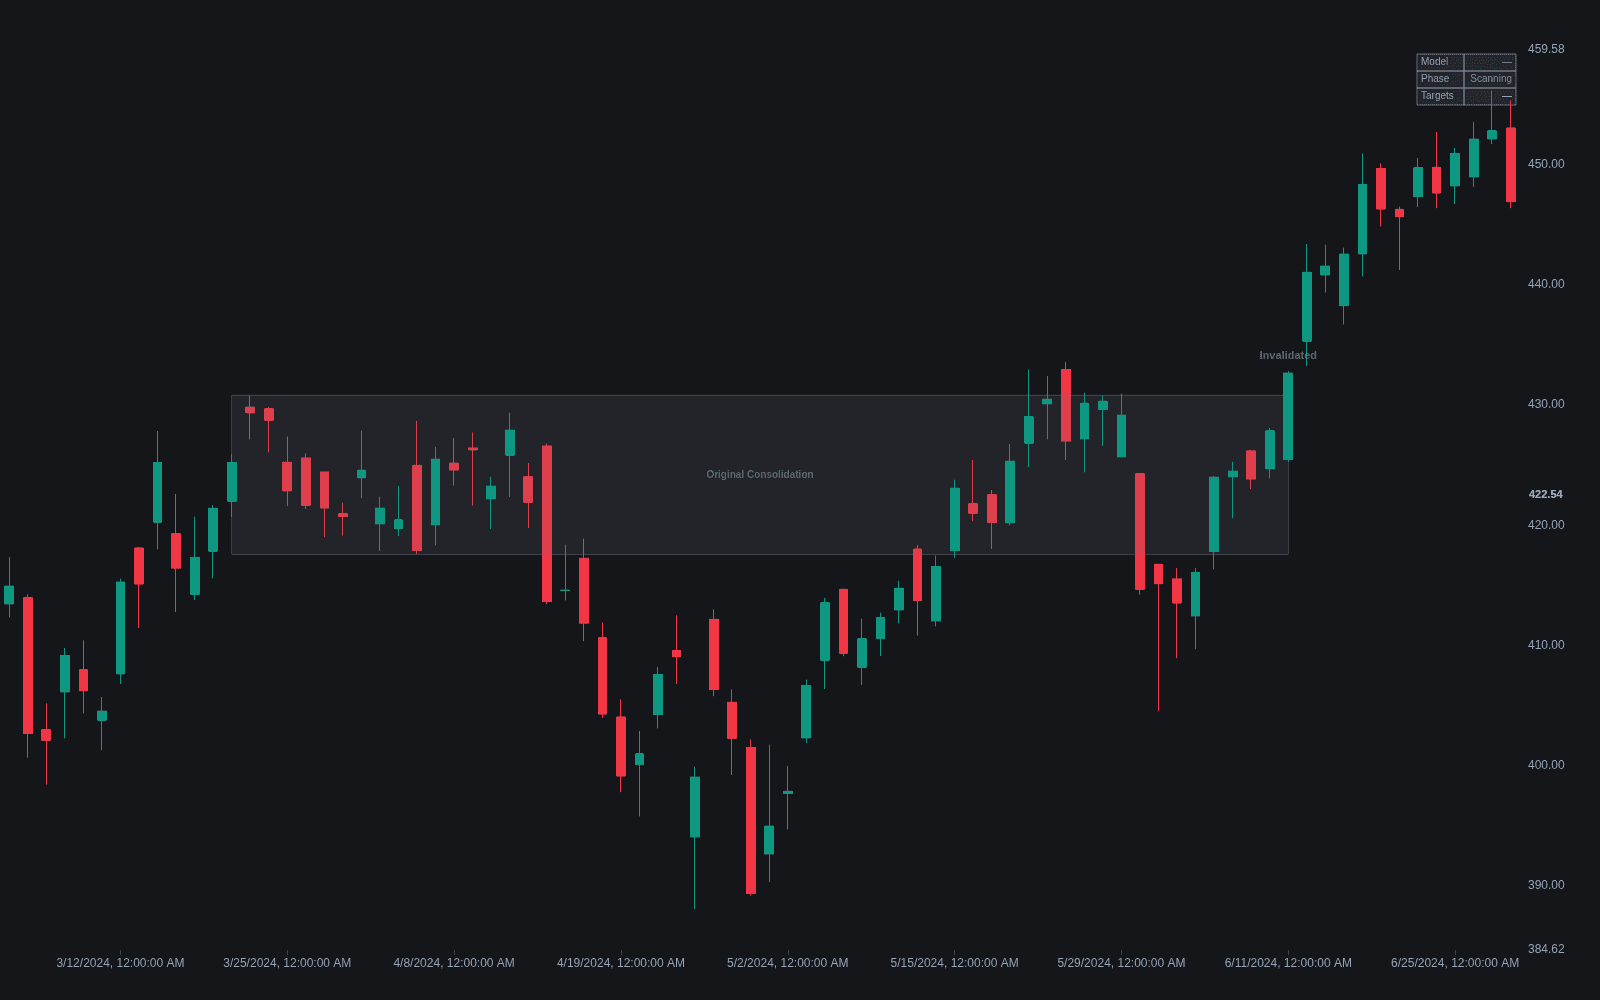
Market Maker Models, also known as MMBM, MMSM, original consolidation, are Smart Money Concepts / ICT concepts. The Library holds 1 implementation, a working definition you can pull into Quant.
Top Market Maker Models indicator
The top custom implementation, built on the original standard Market Maker Models formula.
1 total
The Market Maker Models implementation below can become a backtested trading strategy — describe your rules and Quant writes the code.
What are Market Maker Models?
Market maker models are the ICT schematic for a complete delivery cycle. In the buy model (MMBM), price leaves an original consolidation, works lower in stages (often stepping down through smaller consolidations) until it reaches a sell-side objective, then reverses and retraces the entire path, with the same consolidations it fell through becoming targets on the way back up. The sell model (MMSM) is the mirror image around a high. The two halves are described as the sell side and buy side of a curve, joined by a smart money reversal at its extreme.
The schematic comes from Michael J. Huddleston, who teaches as the Inner Circle Trader (ICT) and whose price-delivery lectures circulated widely online through the 2010s and early 2020s. In his framing, the original consolidation is where large positions are assembled, the staged leg away exists to engineer liquidity, and the return leg is the intended delivery; the abbreviation MMXM covers both variants. Because the material spread through recorded lectures rather than a single text, restatements by other educators differ on the details.
On the chart, the sell side of a buy model typically steps down through two or three smaller consolidations, each leg taking out a liquidity pool under prior lows, until price reaches an old low or an untouched session liquidity level. The turn is expected as a final liquidity sweep followed by displacement the other way, frequently during one of the killzones and often leaving a fair value gap behind. Each half of the curve follows accumulation-manipulation-distribution logic; the model is essentially that template chained into a round trip.
It is a map, not a signal. The model's appeal is that it strings together ideas usually taught separately (consolidation, the run toward a draw on liquidity, reversal, re-delivery) into one arc with pre-defined objectives. Take the name loosely: there is no way to verify that actual market-making desks trade this way, published definitions vary between educators, and real charts rarely deliver the textbook symmetry. Many practitioners use it as higher-timeframe framing rather than a pattern to execute mechanically.
How to identify a market maker model on a chart
The model is mapped left to right on a higher timeframe first, then refined on lower timeframes near the expected turn.
- 1Mark the original consolidation: a clear sideways range, typically on the hourly to daily chart, that price left with a displacement leg.
- 2Trace the staged move away: label each smaller consolidation and short-term high or low formed as price steps toward an obvious objective such as equal lows or a prior session extreme.
- 3Watch the terminus for a sweep-and-reverse: the objective trades through, then price displaces back the other way, ideally during a scheduled window tied to ICT time anchors.
- 4Require lower-timeframe confirmation of the turn, such as a structure shift or a change in the state of delivery, rather than acting on a wick through the level alone.
- 5Project the return: the consolidations mapped earlier become the target sequence, nearest first; the read is void if price closes back through the sweep extreme.
How traders use it
- As a target ladder: once a reversal is suspected at the extreme of the curve, the consolidations and short-term highs or lows formed on the way in become sequenced objectives on the way out, taken level by level rather than as one distant target.
- As context for entries, not the entry itself: the reversal end of the curve is traded with lower-timeframe confirmation such as a change in the state of delivery or a structure shift; the model says where to pay attention, the confirmation says when.
- As a bias frame: deciding which half of the curve price is on (still being delivered away from the original consolidation, or already returning) keeps a trader from fading a move the model expects to extend.
- As an entry-refinement frame: within the reversal leg, entries are commonly taken at a bullish or bearish order block or an optimal trade entry retracement of the displacement leg, with risk behind the swept extreme.
- As a target-extension tool: once the interior consolidations are consumed, standard-deviation projections of the manipulation leg commonly frame objectives beyond the original consolidation.
Market maker models vs related ICT concepts
Accumulation-manipulation-distribution: AMD, or the power of three, is the single-cycle template: build positions, run the false move, deliver. A market maker model chains that logic into a full round trip with a defined midpoint reversal.
Liquidity Sweep: A liquidity sweep is a single event: stops taken beyond a level and price reversing. The market maker model is an itinerary of sweeps that uses each one as a stage marker; a sweep trades on its own, the model needs the whole sequence.
Bullish/bearish Order Block: Order blocks are candle-level zones used to time entries inside the curve. The model supplies direction and targets; order blocks supply the price at which to act. One is the map, the other is a waypoint on it.
Concept family
Smart Money Concepts / ICT
54 concepts mapped · 54 in the Library
Market Maker Models FAQ
Turn Market Maker Models into a trading strategy.
Take the implementation from this page into Quant, then build on it, backtest it on real data, and keep refining it in conversation.