Concept
Maximum-entropy Spectrum
Maximum-entropy Spectrum is a Statistics concept. The Library holds 1 implementation, a working definition you can pull into Quant.
MESA
Top Maximum-entropy Spectrum indicator
The top custom implementation, built on the original standard Maximum-entropy Spectrum formula.
1 total
Want to trade Maximum-entropy Spectrum? The implementation below is one prompt away from a backtested strategy in Quant.
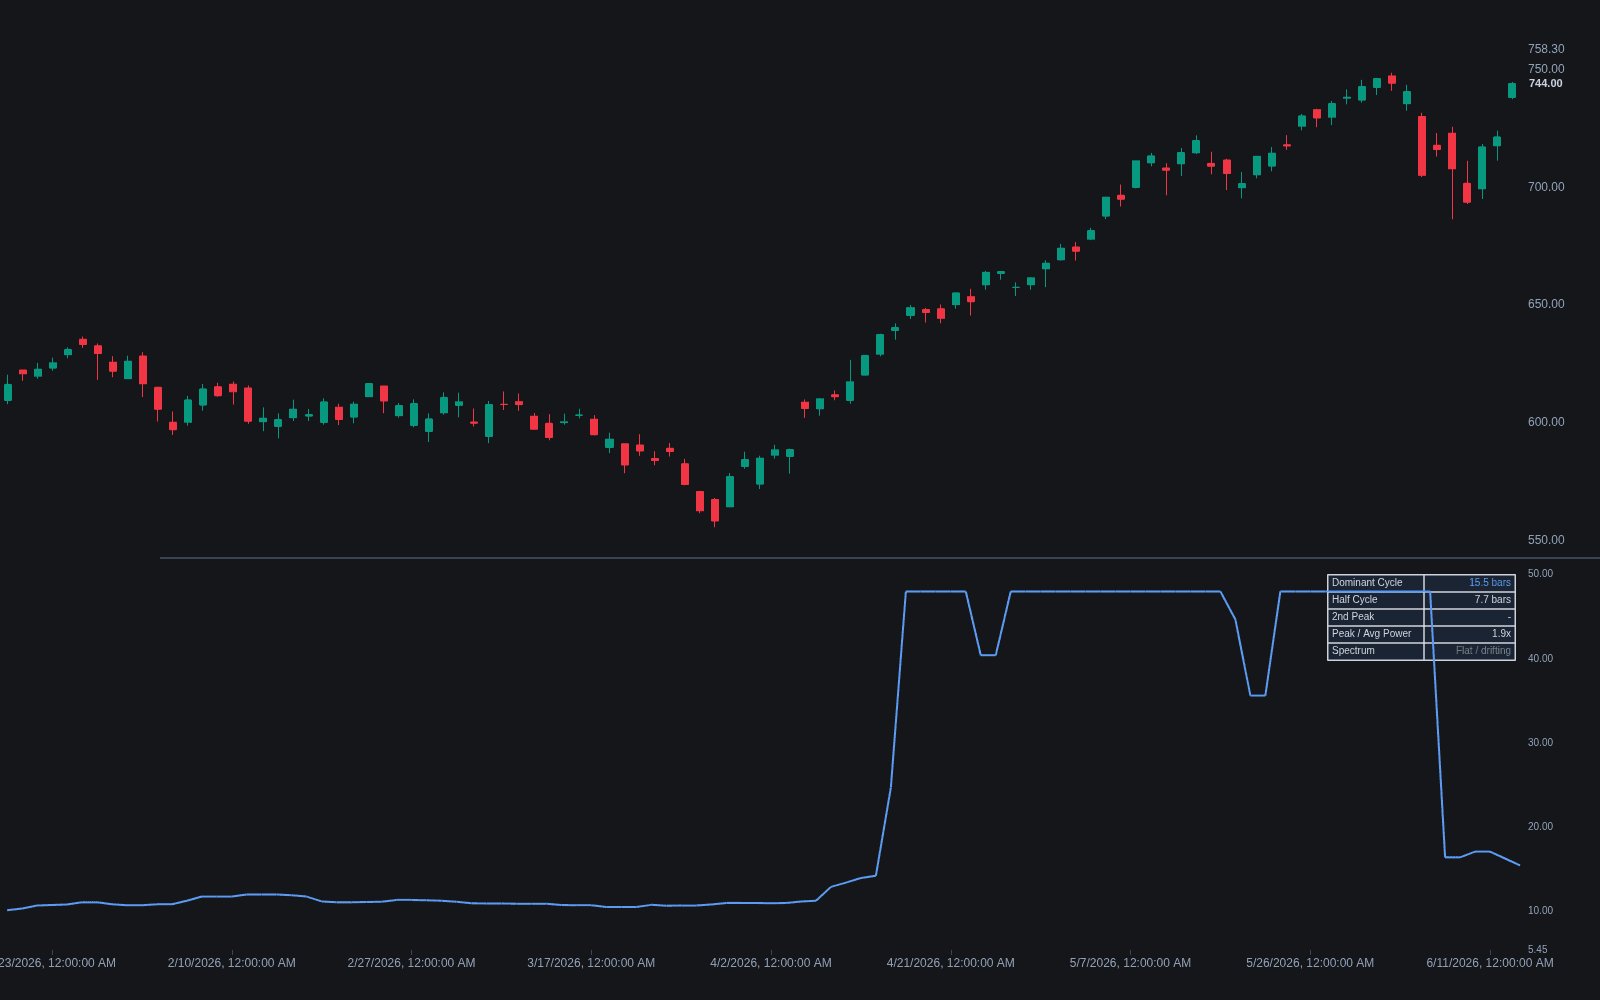
What is a Maximum-Entropy Spectrum?
Maximum-entropy spectral analysis, widely known by the acronym MESA, is a method for estimating which cycle periods are present in a data series. Rather than transforming the data directly as FFT spectral analysis does, it fits an autoregressive model to the series and derives the spectrum from the fitted coefficients. Of all spectra consistent with the measured autocorrelations, it selects the one with maximum entropy, meaning the one that assumes the least about data outside the sample. The approach was introduced by geophysicist John Parker Burg in the late 1960s.
Its appeal for market work is resolution on short samples. A Fourier transform of 64 bars can only resolve a coarse grid of periods and implicitly assumes the sample repeats forever; the maximum-entropy spectrum can produce sharp spectral peaks from a few dozen observations without that assumption. Since market cycles drift in period and phase, any usable measurement window is necessarily short, which is precisely the regime where the technique tends to outperform the periodogram.
The method entered trading largely through John Ehlers, whose MESA software applied it to estimate the dominant market cycle and tune indicators to it. It sits alongside other period estimators in the Ehlers toolbox, such as the Hilbert transform approach and the autocorrelation periodogram, all feeding the same downstream use: giving adaptive indicators a defensible cycle period instead of a guessed one.
How it's calculated
The series is modeled as an autoregressive process, and the spectrum follows from the fitted coefficients. There is no single closed-form indicator; this is the standard AR spectral form:
Burg's method fits the coefficients by minimizing forward and backward prediction error, which is what gives the technique its short-sample resolution.
Input conditioning matters: practitioners detrend or high-pass the data first so the trend does not masquerade as a very long cycle.
How traders use it
- Dominant cycle estimation: the location of the strongest spectral peak is read as the market's current dominant period, which then drives dominant cycle measurement applications like setting oscillator lookbacks to a half or full cycle.
- Adaptive indicator tuning: adaptive constructions such as MAMA/FAMA style tools depend on a period estimate; a maximum-entropy spectrum is one of the higher-resolution ways to supply it from short windows.
- Regime awareness: a spectrum with one sharp, persistent peak suggests a tradeable rhythm, while a flat or shifting spectrum warns that cycle-based timing has little to grip; some traders use that contrast as a filter before deploying cycle strategies.
- Its limitations are real: the AR model order is a sensitive choice (too low blurs peaks, too high invents them), trends and volatility shifts must be removed first, and a sharp peak in-sample says nothing about whether the cycle persists forward.
Maximum-entropy spectrum vs related concepts
FFT Spectral Analysis: The FFT computes the spectrum directly and needs long, stationary samples for fine period resolution; the maximum-entropy approach models the data first, achieving sharper peaks from far shorter windows at the cost of a model-order choice.
Autocorrelation Periodogram: Ehlers' later preferred period estimator, built from autocorrelations at multiple lags; it is simpler and tends to be more stable bar to bar, while the maximum-entropy spectrum offers finer resolution when its order is well chosen.
Hilbert Transform: The Hilbert transform tracks the instantaneous phase of an assumed single dominant cycle; a maximum-entropy spectrum shows the whole period landscape at once, including competing cycles.
Concept family
Statistics
46 concepts mapped · 46 in the Library
Maximum-entropy Spectrum FAQ
Turn Maximum-entropy Spectrum into a trading strategy.
Take the implementation from this page into Quant, then build on it, backtest it on real data, and keep refining it in conversation.