Concept
Entropy Measures
Entropy Measures, also known as Shannon, approximate, sample, permutation, are Statistics concepts. The Library holds 1 implementation, a working definition you can pull into Quant.
Top Entropy Measures indicator
The top custom implementation, built on the original standard Entropy Measures formula.
1 total
This Entropy Measures implementation is strategy-ready: open it in Quant, set your rules, and it backtests automatically.
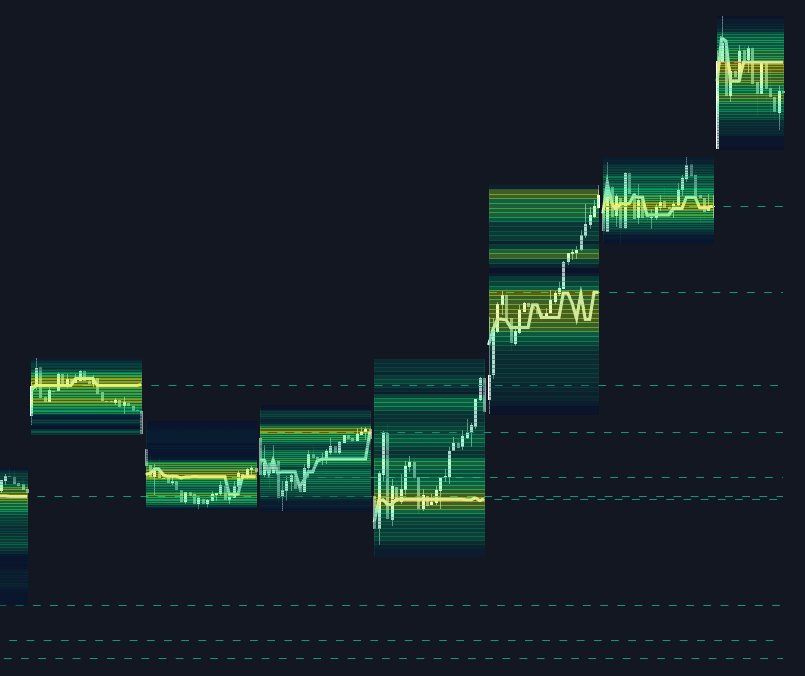
What are Entropy Measures?
Entropy measures quantify how disordered or unpredictable a series is. The root idea is Claude Shannon's 1948 information theory: bin the data, estimate the probability of each outcome, and sum probability times negative log-probability. The result peaks when every outcome is equally likely and falls to zero when one outcome is certain, so it reads as the average surprise per observation. Applied to returns, it asks how evenly recent outcomes are spread across their range.
Time-series variants ask a sharper question about pattern persistence. Approximate entropy, introduced by Steven Pincus in 1991, and sample entropy, a 2000 refinement by Richman and Moorman that removes its self-matching bias, track how often matching patterns of m consecutive values keep matching at length m+1, scored so that more persistence means a lower reading. Permutation entropy, proposed by Bandt and Pompe in 2002, applies the Shannon formula to ordinal patterns, the rank orderings of consecutive values, which makes it robust to outliers and indifferent to magnitude.
The trading translation: low entropy means repeating structure that trend or cycle logic can grip; high entropy means noise-like behavior where most signals degrade. Entropy is therefore a regime input rather than a signal generator, similar in role to the Hurst exponent and fractal dimension but built from information theory rather than scaling behavior. It also complements autocorrelation: correlation detects only linear dependence at fixed lags, while entropy responds to any repeated structure, linear or not.
Every variant is sensitive to its settings. Bin counts change Shannon readings, embedding length and tolerance change approximate and sample entropy, and window length controls how fast any of them react. Readings therefore only compare under fixed parameters, and most practitioners normalize them, against the theoretical maximum or via a rolling percentile rank, before calling a value high or low. On finite, noisy market data the estimates are themselves noisy, so entropy is usually smoothed and read as a slowly shifting backdrop rather than a bar-by-bar trigger.
How to Identify Entropy Regimes on a Chart
Entropy plots as an indicator pane, so identification means learning what its extremes look like against price:
- 1Add an entropy indicator and fix its parameters (window, embedding length, tolerance, or bin count); every comparison that follows assumes they do not move.
- 2Establish the local range: note where readings have sat over the past few hundred bars, since raw entropy values have no universal scale.
- 3Mark the low-entropy stretches and check price: they should coincide with cleaner trends, steadier cycles, or orderly ranges.
- 4Mark the high-entropy stretches: choppy, gappy, or news-driven tape where recent patterns fail to repeat.
- 5Watch transitions rather than levels: a fall toward the lower range says structure is emerging; the reverse says an orderly phase is dissolving.
How it's calculated
A family of randomness measures scoring how unpredictable a price or return series is over a lookback window.
Inputs are usually closes or log returns over a rolling window, commonly 100 to 500 bars.
Higher readings mean a less predictable series, lower readings more regularity.
Permutation entropy is often normalized by ln(m!); Shannon entropy uses log2 for bits, and natural-log versions differ only by a constant factor.
How traders use it
- As a tradability filter: high-entropy stretches argue for standing aside or reducing size, while falling entropy suggests structure is emerging and pattern or trend signals have better footing.
- As an input to adaptive parameterization: smoothing lengths and signal thresholds scale with measured entropy so tools slow down in noise and speed up in order, the role measurement noise plays in a Kalman filter.
- For cross-sectional comparison: ranking instruments or timeframes by entropy to direct attention toward the most structured ones.
- As a gate on periodic tools: outputs from dominant cycle measurement or FFT/spectral analysis are trusted only when entropy is low enough for a cyclic read to be meaningful.
- As a multi-window view: entropy computed over several lookbacks at once and color-coded, so shifts in structure show up across scales.
Entropy Measures vs related concepts
Fractal Dimension: Both grade order versus noise, but fractal dimension measures how jagged the price path is through its scaling behavior, while entropy measures how unpredictable the sequence of outcomes is. A smooth but erratic series and a jagged but repetitive one can score differently on each.
Autocorrelation: Autocorrelation detects linear dependence at specific lags and carries a sign, so it distinguishes trending from mean-reverting behavior. Entropy is unsigned and blind to direction: it says how much structure exists, not what kind.
Distribution-of-returns Profiling: Profiling examines the shape of the return distribution: skew, tails, modes. Entropy compresses predictability into one number, and its pattern-based variants care about the ordering of values, which a distribution ignores entirely.
Concept family
Statistics
46 concepts mapped · 46 in the Library
Entropy Measures FAQ
Turn Entropy Measures into a trading strategy.
Take the implementation from this page into Quant, then build on it, backtest it on real data, and keep refining it in conversation.