Concept
Sinewave Indicator
Sinewave Indicator is a Statistics concept. The Library holds 2 implementations, each one a working definition you can pull into Quant.
Top Sinewave Indicator indicators
The top custom implementations, built on the original standard Sinewave Indicator formula.
2 total
Any of the 2 Sinewave Indicator implementations below can become a backtested trading strategy — describe your rules and Quant writes the code.
What is the Sinewave Indicator?
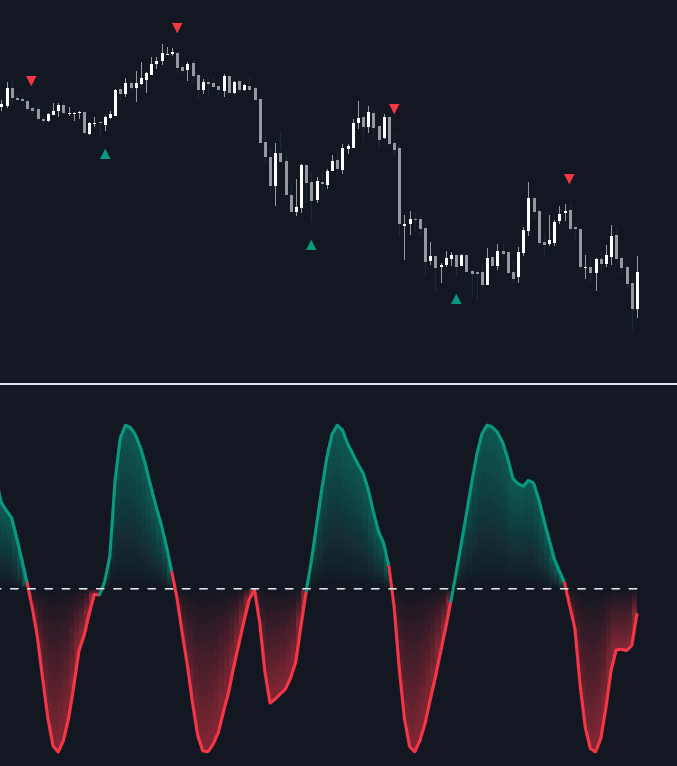
The Sinewave Indicator is John Ehlers' cycle-timing tool. Instead of smoothing price the way a conventional oscillator does, it estimates the phase of the market's dominant cycle (see dominant cycle measurement, classically done with the Hilbert Transform) and plots two lines: the sine of that phase, and a lead line, the sine of the phase advanced by 45 degrees. When price is genuinely cycling, the two lines cross close to cycle troughs and crests, so turns register with little of the lag a fixed-length oscillator carries.
Its second property is just as useful: trend detection by silence. In a trending market the phase stops advancing at a steady rate, and the sine and lead lines flatten out and run roughly parallel without crossing. Active, regular crossings say the market is cycling and turn-timing applies; a quiet, uncrossed pair says the market is trending and cycle signals should be stood down. The indicator only anticipates turns when a reasonably stable cycle actually exists, which is why implementations condition the input first.
The geometry explains the anticipation. A lagging oscillator must watch price roll over before it can turn; the sinewave pair instead crosses at a fixed phase margin ahead of the cycle extreme, because the lead line runs 45 degrees in front of its sibling. When the phase estimate is clean, the crossing therefore lands before the price turn it predicts, an advance notice bought entirely from the phase measurement rather than from any smoothing trick. The same dependence is the weakness: every degree of jitter in the measured phase translates directly into crossing noise, which is why the indicator inherits the conditioning requirements of the phase engine underneath it.
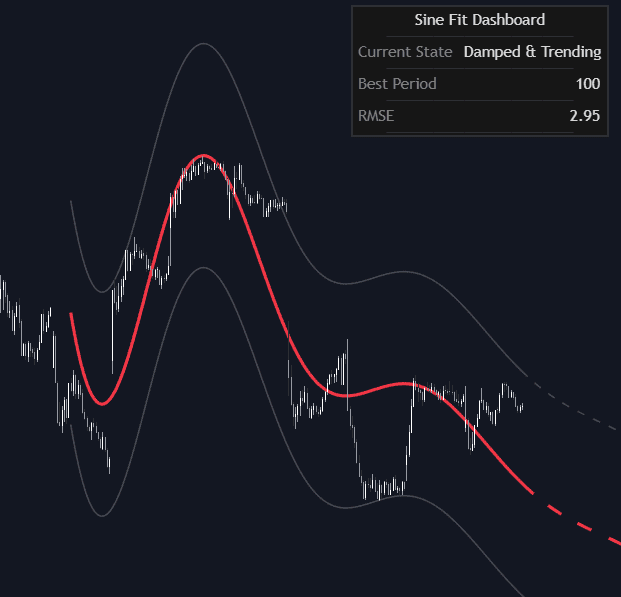
Ehlers published the design within his broader cycle-analysis work around the turn of the millennium, and the Library carries both the classic and its modern descendants. jacobnie2008's Hilbert Sine Wave Support and Resistance projects the measured cycle onto price as adaptive levels; LuxAlgo's Correlated Sine Oscillator estimates cycle position by correlating price against sine shapes rather than through a Hilbert pair; and the Variable Sine Wave Fit goes a step further, fitting a sine of variable period and amplitude directly to price. All inherit the same honest constraint: the message is conditional on a stable cycle existing, and the tool's most reliable output is often its statement that none currently does.
How to identify the Sinewave Indicator's readings
Reading the tool means knowing which of its two modes the market is in; everything else follows.
- 1Confirm the input is conditioned: detrended or bandpassed price, since trend leaking into the phase estimate corrupts everything downstream.
- 2Locate the phase engine: a Hilbert-based estimator classically, or a correlation-based alternative in newer variants.
- 3Watch the pair in cycle mode: regular alternating crossings of the sine and lead lines, arriving slightly ahead of price turns, are the tool working as designed.
- 4Recognize trend mode: the two lines flattening and running parallel without crossing is a deliberate signal to stand cycle tactics down.
- 5Distrust the boundary: around regime shifts the phase estimate slews, producing crossings that belong to neither mode; conservative use waits for the new mode to establish.
How traders use it
- Timing cycle turns in ranges: crossings of the sine and lead-sine lines flag expected troughs and crests of the measured cycle, so mean-reversion entries can be taken toward the opposite extreme rather than after a lagging oscillator confirms.
- As a trend/cycle regime filter: when the two lines stop crossing and run parallel, the market is treated as trending and cycle-based fade signals are disabled. Some traders use the indicator purely for this mode call.
- With conditioned input: the phase estimate degrades when trend and noise leak into the measurement, so implementations typically detrend or bandpass price first (a roofing filter is the standard Ehlers preprocessing) before computing the sinewave.
- As cycle-anchored support and resistance: projecting the measured cycle's turns onto price yields adaptive levels that shift with the rhythm, the approach packaged in Hilbert sine wave S/R tools.
- Through correlation variants: estimating cycle position by correlating price against candidate sine shapes trades the Hilbert machinery for a simpler, sometimes steadier phase read, at the cost of assuming the cycle shape more strongly.
Sinewave Indicator vs related cycle tools
Hilbert Transform: The Hilbert transform is the measurement engine, producing per-bar phase and amplitude; the Sinewave Indicator is a display built on that phase. The division of labor matters: most sinewave problems are phase-estimate problems, inherited from the engine rather than the readout.
FFT/Spectral Analysis: An FFT decomposes a window into its full spectrum, revealing several cycles at once but assuming they held still across the window. The sinewave tracks one dominant cycle live, bar by bar. Survey versus tracker: one maps the terrain, the other follows the target.
Autocorrelation: Autocorrelation methods find the period by matching the series against its own lags, a robust but coarser read that Ehlers himself later favored for period estimation in noise. The sinewave needs finer phase information than autocorrelation provides, which is why the two often cooperate: period from one, timing from the other.
Concept family
Statistics
46 concepts mapped · 46 in the Library
Sinewave Indicator FAQ
Turn Sinewave Indicator into a trading strategy.
Take any implementation from this page into Quant, then build on it, backtest it on real data, and keep refining it in conversation.