Concept
Fractal Dimension
Fractal Dimension is a Statistics concept. The Library holds 1 implementation, a working definition you can pull into Quant.
Top Fractal Dimension indicator
The top custom implementation, built on the original standard Fractal Dimension formula.
1 total
Want to trade Fractal Dimension? The implementation below is one prompt away from a backtested strategy in Quant.
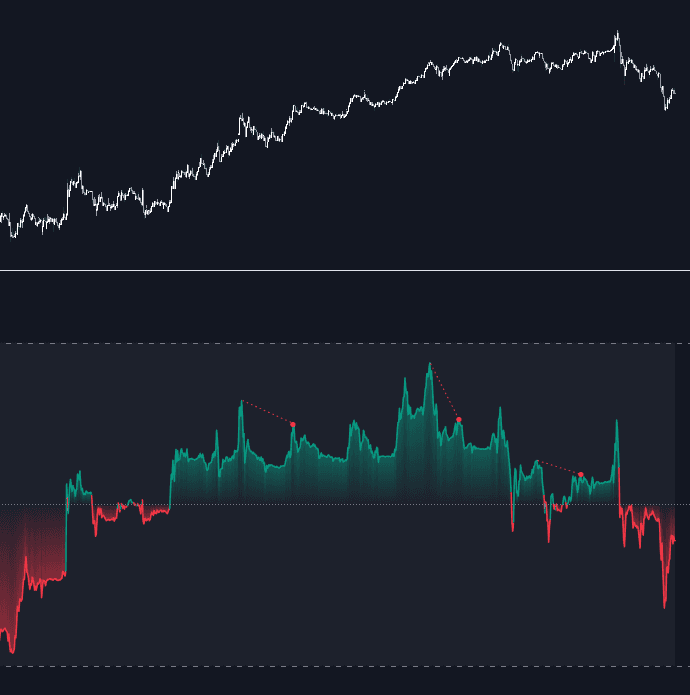
What is Fractal Dimension?
Fractal dimension measures how rough a curve is, or equivalently how much space it fills. A straight line has dimension 1; a path so jagged it effectively fills the plane approaches 2. Applied to a price series over a lookback window, it scores choppiness: readings near 1 describe a smooth, directional path, readings around 1.5 resemble a random walk, and readings pushing toward 2 describe dense, congested oscillation. The idea traces to Benoit Mandelbrot, who argued that markets are better described by fractal geometry than by smooth Gaussian models, and for self-affine series it mirrors the Hurst exponent: dimension equals two minus Hurst.
A chart can only estimate fractal dimension from finite data. Common estimators include box counting, Higuchi's and Katz's methods, and the range-based estimate John Ehlers used in FRAMA, which compares the length-normalized high-low ranges of the two halves of a window with that of the whole: when the halves sum to much more than the whole, the path is rough and the estimated dimension is high. Estimates are window-dependent and noisy, so they are best read as a relative regime gauge rather than a precise constant.
The estimators embody one shared idea, measuring the curve at two resolutions and comparing: a smooth path measures about the same length either way, while a rough one reveals ever more detail as the ruler shrinks. Box counting formalizes this by covering the curve with grids of shrinking cells; Higuchi's method reconstructs curve lengths across skip intervals and reads the dimension from their scaling, generally the most faithful of the cheap estimators; Katz's normalizes path length by its diameter; and Ehlers' two-half comparison strips the same logic to three range measurements, crude but fast enough to drive an adaptive filter every bar. On charts, windows of thirty to a hundred bars are typical, short enough to track regimes and long enough to estimate anything.
Applications split by what the number modulates. As a regime gauge it gates strategies, trend logic enabled while the dimension runs low, mean-reversion or stand-aside as it climbs; as an adaptivity input it retunes tools continuously, FRAMA mapping the estimate to a smoothing factor and dimension-weighted oscillators like the Library's chaos-weighted RSI scaling their sensitivity by roughness. The honest workflow treats absolute readings skeptically, calibrating zones per instrument, ranking the estimate against its own percentile history, and cross-checking against independent gauges, since different estimators legitimately disagree on the same window.
How to identify fractal dimension readings
Estimate, calibrate, and read relative: the number only means something against its own history.
- 1Choose the window and estimator: thirty to a hundred bars, with Ehlers' range method for speed or Higuchi's for fidelity.
- 2Compute the estimate per bar, producing a series that oscillates roughly between 1 and 2.
- 3Calibrate the zones on the instrument itself: where its trending stretches, random drifts and congestion episodes actually print.
- 4Prefer relative reads: percentile position against the estimate's own history travels across instruments better than fixed thresholds.
- 5Cross-check regime calls against independent gauges, path efficiency or entropy, and trust the call most where the independent measures agree.
How traders use it
- As a regime filter: low readings flag persistent, trending stretches, while readings near or above the random-walk zone flag chop, where trend-following signals are more likely to whipsaw.
- As the adaptivity input inside moving averages: FRAMA-style filters map the dimension estimate to a smoothing factor, so the average speeds up when price trends cleanly and flattens out during congestion.
- As a cross-check alongside related gauges such as the Kaufman efficiency ratio; agreement between independent roughness measures adds confidence to a trend-versus-range call.
- As an oscillator modulator: dimension-weighted designs scale an oscillator's sensitivity by measured roughness, damping signals in congestion and letting them breathe in clean trends.
- For exposure modulation: systematic overlays size positions down as measured roughness rises, treating the dimension as a proxy for how hostile current conditions are to directional holding.
Fractal dimension vs related roughness measures
Hurst Exponent: For self-affine series the two encode the same information, dimension equals two minus Hurst, but they are estimated by different algorithms on finite windows and routinely disagree in practice. Dimension frames the question as geometric roughness, Hurst as long-range persistence.
Kaufman Efficiency Ratio: The efficiency ratio is the poor man's roughness gauge: net travel over total travel, one division, no scaling theory. It reacts faster and estimates more crudely than any dimension method. The two make natural cross-checks precisely because their machinery shares nothing.
Entropy Measures: Entropy quantifies disorder in the distribution of moves, information-theoretic rather than geometric: a series can be geometrically rough yet statistically predictable, and vice versa. Regime dashboards run both because they fail differently.
Concept family
Statistics
46 concepts mapped · 46 in the Library
Fractal Dimension FAQ
Turn Fractal Dimension into a trading strategy.
Take the implementation from this page into Quant, then build on it, backtest it on real data, and keep refining it in conversation.