Concept
Wavelet Decomposition
Wavelet Decomposition is a Statistics concept. The Library holds 1 implementation, a working definition you can pull into Quant.
Top Wavelet Decomposition indicator
The top custom implementation, built on the original standard Wavelet Decomposition formula.
1 total
Want to trade Wavelet Decomposition? The implementation below is one prompt away from a backtested strategy in Quant.
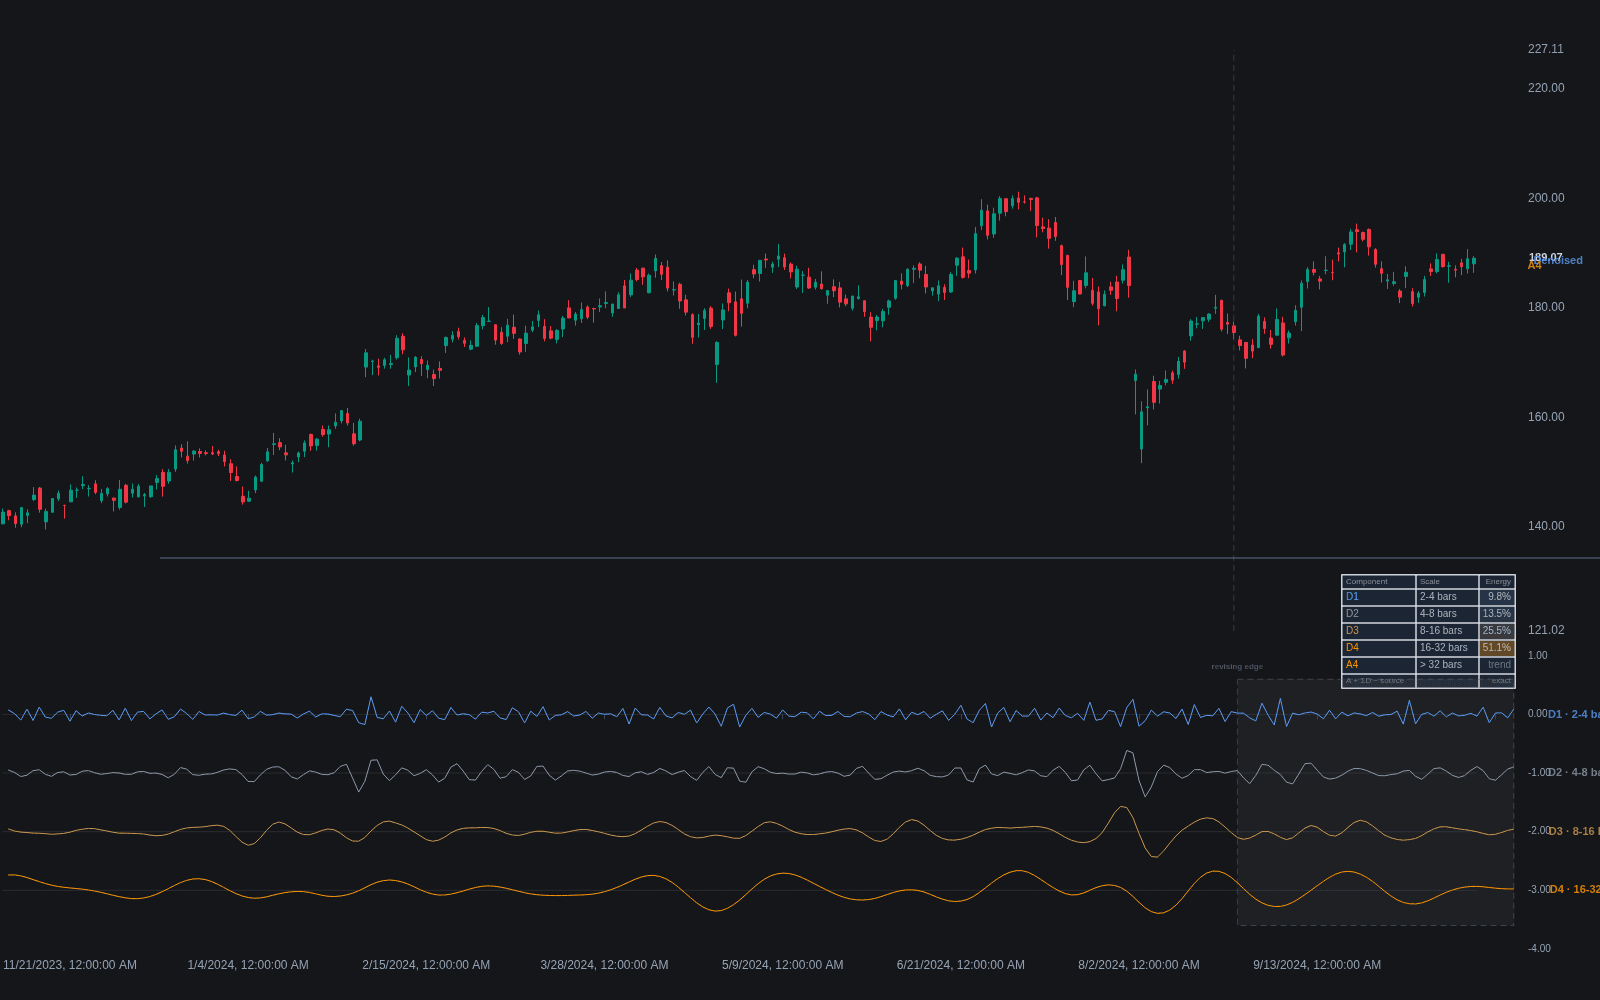
What is wavelet decomposition?
Wavelet decomposition splits a time series into components at different scales: a smooth approximation capturing the slow trend, plus layers of detail capturing progressively faster fluctuations. Unlike FFT spectral analysis, which describes a series in terms of sines that extend over the whole sample, wavelets are localized little waves, so the decomposition says not just which frequencies are present but when. That time-frequency localization is the whole point for markets, where the character of price movement changes constantly.
The standard machinery is the discrete wavelet transform (DWT) and its shift-invariant variant (often called MODWT), built on wavelet families such as Haar or Daubechies. Each level of the transform halves the frequency band: level-1 detail holds the fastest wiggles, level-2 the next octave down, and so on, with the final approximation holding what remains. Summing all components reconstructs the original series exactly, which makes wavelets a principled form of signal decomposition rather than an ad hoc smoothing stack.
Traders and researchers use the decomposition to separate concerns: denoise a series by suppressing the finest details, extract a trend by keeping only the approximation, or study how volatility and correlation behave at different horizons. The recurring caveat is the boundary problem. Wavelet filters need data on both sides of a point, so values near the right edge of the sample are computed from padded or asymmetric data and revise as new bars arrive, a repainting behavior that has burned many an unwary backtester.
How it's calculated
There is no single formula; the canonical scheme is the pyramid algorithm of the discrete wavelet transform. One level of decomposition is:
The MODWT variant skips the downsampling by 2, keeping every level aligned with the original bars, which many time-series practitioners prefer.
Wavelet choice and depth J are tuning decisions; Haar is the simplest and most edge-friendly, longer wavelets are smoother but worsen boundary effects.
How traders use it
- Denoising: suppress or threshold the finest detail levels and reconstruct, producing a smoothed series that adapts locally instead of applying one fixed bandwidth everywhere; the aggressiveness is set by how many levels are removed.
- Multi-horizon analysis: examine detail energies by level to see which timescales carry the movement, a quantitative cousin of looking at multiple chart timeframes at once.
- Feature construction: wavelet coefficients or per-level variances serve as model inputs, letting a classifier see short-term and long-term behavior as separate features rather than one entangled series.
- Trend extraction: keep the approximation and coarsest details as a trend estimate, an alternative to tools like the Hodrick-Prescott filter with more explicit control over which scales survive.
- The critical limitation for live trading: near the current bar the transform relies on boundary handling, so recent values revise as data arrives. Any strategy built on wavelet output needs the discipline of repaint-safe engineering, or a causal reformulation.
Wavelet decomposition vs related concepts
FFT Spectral Analysis: Fourier analysis assumes the same frequency mix holds across the whole sample; wavelets localize in time as well as frequency, which suits markets whose rhythm changes from month to month.
Signal Decomposition: The umbrella idea of splitting price into trend, cycle, and noise components; wavelet decomposition is one specific, exactly invertible way to do it, with scales fixed by octave rather than fitted.
Kalman Filter: A Kalman filter extracts components causally, updating from past data only, so it never repaints; wavelet transforms look both directions in time, giving cleaner in-sample separation but unreliable values at the live edge.
Concept family
Statistics
46 concepts mapped · 46 in the Library
Wavelet Decomposition FAQ
Turn Wavelet Decomposition into a trading strategy.
Take the implementation from this page into Quant, then build on it, backtest it on real data, and keep refining it in conversation.