Concept
Percentile Rank
Percentile Rank, also known as quantile analysis, is a Statistics concept. The Library holds 2 implementations, each one a working definition you can pull into Quant.
Top Percentile Rank indicators
The top custom implementations, built on the original standard Percentile Rank formula.
2 total
Any of the 2 Percentile Rank implementations below can become a backtested trading strategy — describe your rules and Quant writes the code.
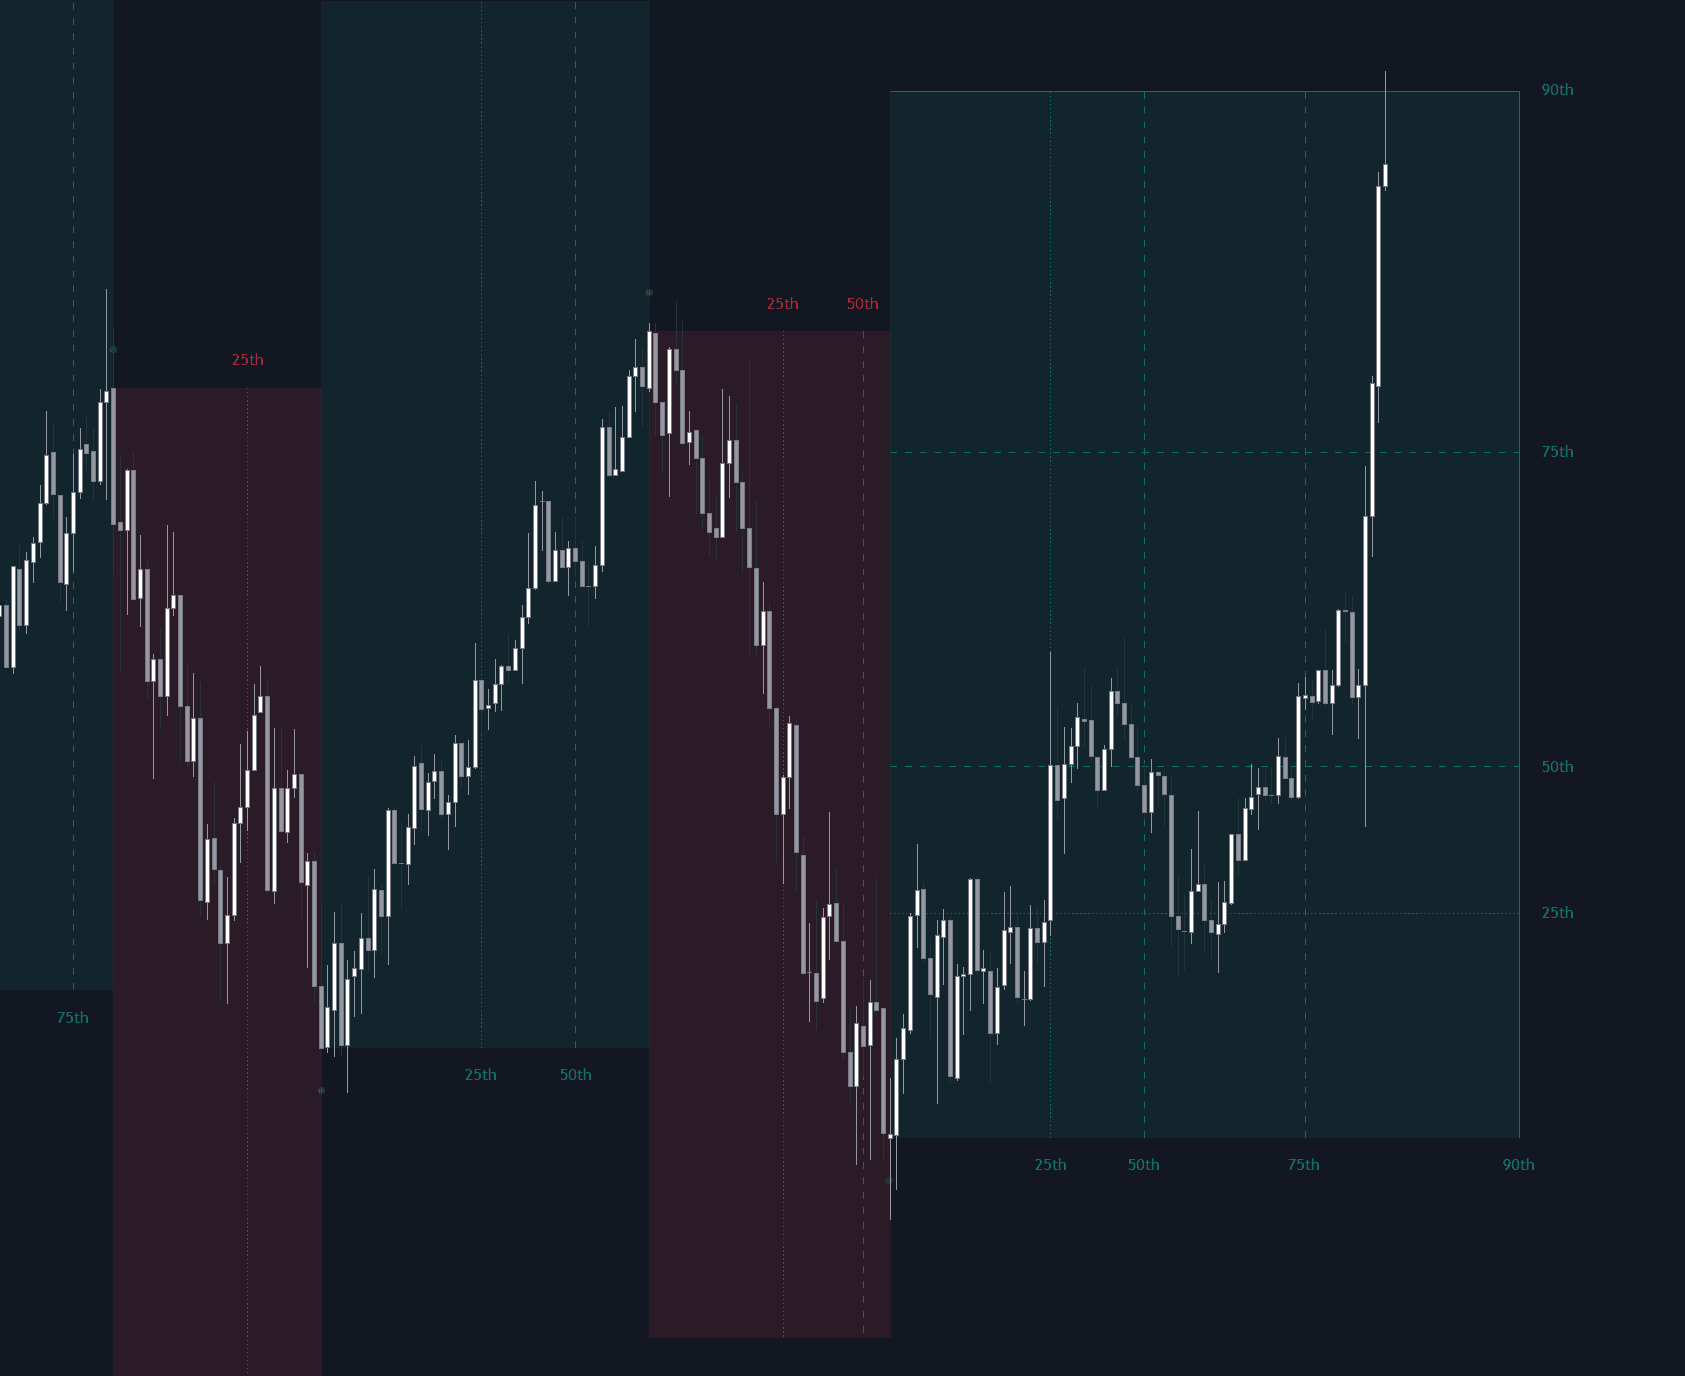
.png&w=3840&q=75)
What is Percentile Rank?
Percentile rank locates the current value of a series within its own recent history: it is the percentage of values in a lookback window that sit at or below the current one. A rank of 100 means nothing in the window exceeds it, a rank near 0 means almost everything does, and 50 sits at the median. Because the calculation uses order alone, it is distribution-free: one monster outlier in the window counts as just another observation above or below, and no normality assumption is required.
That robustness is why it appears wherever raw values are hard to compare. Options traders express implied volatility as a percentile of its past year, systems convert ATR or volume into a 0-100 regime dial, and machine-learning pipelines rank-transform features before combining them. The limitation is symmetrical: rank reports rarity within the chosen window, not direction or follow-through, and in a persistent trend a series can keep printing in its top decile for weeks.
The conventions matter more than they look. Implementations differ on whether the current value is included in its own window, whether ties count as 'at or below', and whether ranks interpolate between order statistics; on large windows the differences vanish, on 20-bar windows they visibly move the reading. Serial dependence adds a second subtlety: a strongly trending or autocorrelated series revisits its extremes repeatedly, so top-decile readings arrive in runs rather than as isolated events.
In workflow terms, rank is the nonparametric half of a standardization pair. Where a z-score trusts the mean and deviation, rank trusts only order, which makes it the safer transform exactly where market data misbehaves, in the fat-tailed, skewed distributions that return profiling documents. The price is resolution: rank caps at its window's edges and cannot say how far beyond all previous values a genuinely new extreme has gone.
How to calculate Percentile Rank
The nearest-rank calculation is counting, which is exactly why it is so robust.
- 1Collect the last N values of the series; this window is the reference distribution the current value is judged against.
- 2Count how many of those N values are less than or equal to the current value.
- 3Divide the count by N and multiply by 100 for a 0-100 reading. Implementations differ slightly (whether the current bar is counted in the window, nearest-rank versus interpolated definitions), which matters mainly on small windows.
- 4Fix the conventions once, tie handling, inclusion, interpolation, and keep them constant, so readings remain comparable across time and symbols.
- 5Read runs, not prints: on persistent series, extremes arrive in sequences, and the exit from an extreme decile is often the more informative event than the entry.
How it's calculated
Percentile rank locates the current value inside its own recent history, as the percentage of lookback values at or below it.
Conventions differ on strict < versus <= and on whether the current bar joins the window; TradingView's percentrank compares the current value against the previous n bars using <=.
Nearest-rank and linear-interpolation quantile methods return slightly different values on small windows.
How traders use it
- As adaptive overbought/oversold levels: instead of fixed oscillator thresholds, extremes are declared when a reading enters the top or bottom decile of its own history, so the bar for 'extreme' moves with the instrument's behavior.
- As a volatility regime switch: the volatility percentile of ATR or realized volatility decides which playbook applies, for example favoring range tactics in low percentiles and breakout tactics in high ones.
- As a participation filter: relative volume screens rank current volume against comparable history, so 'heavy' means heavy for that symbol at that time of day rather than an absolute number.
- As a cross-sectional ranking: scoring many symbols by the same statistic and trading the top and bottom ranks is the standard construction of rotation and relative-strength baskets, with rank neutralizing each symbol's own scale.
- As an outcome scorecard: expressing a realized move as a percentile of history, or of a simulated distribution, turns post-trade review into measured statements rather than adjectives.
Percentile Rank vs related concepts
Z-score: A z-score measures distance from the mean in standard deviations, so it preserves magnitude and can exceed any bound; percentile rank uses order only and caps at 0 and 100. Ranks are more robust to outliers, z-scores more informative about how extreme an extreme actually is.
Min-max Scaling: Min-max scaling places the value proportionally between the window's low and high, so distances matter and one spike rescales everything. Percentile rank only counts how many values sit at or below. The options-market pair IV Rank (min-max) and IV Percentile (rank) shows how far apart the two can drift.
Stochastic Oscillator: %K is min-max scaling of the close within the recent high-low range, not a count of past values. A stochastic near 100 says price is at the top of its range; a percentile rank near 100 says almost no recent value was higher. Similar look, different arithmetic.
Concept family
Statistics
46 concepts mapped · 46 in the Library
Percentile Rank FAQ
Turn Percentile Rank into a trading strategy.
Take any implementation from this page into Quant, then build on it, backtest it on real data, and keep refining it in conversation.