Concept
Even-better Sinewave
Even-better Sinewave is a Statistics concept. The Library holds 1 implementation, a working definition you can pull into Quant.
Top Even-better Sinewave indicator
The top custom implementation, built on the original standard Even-better Sinewave formula.
1 total
The Even-better Sinewave implementation below can become a backtested trading strategy — describe your rules and Quant writes the code.
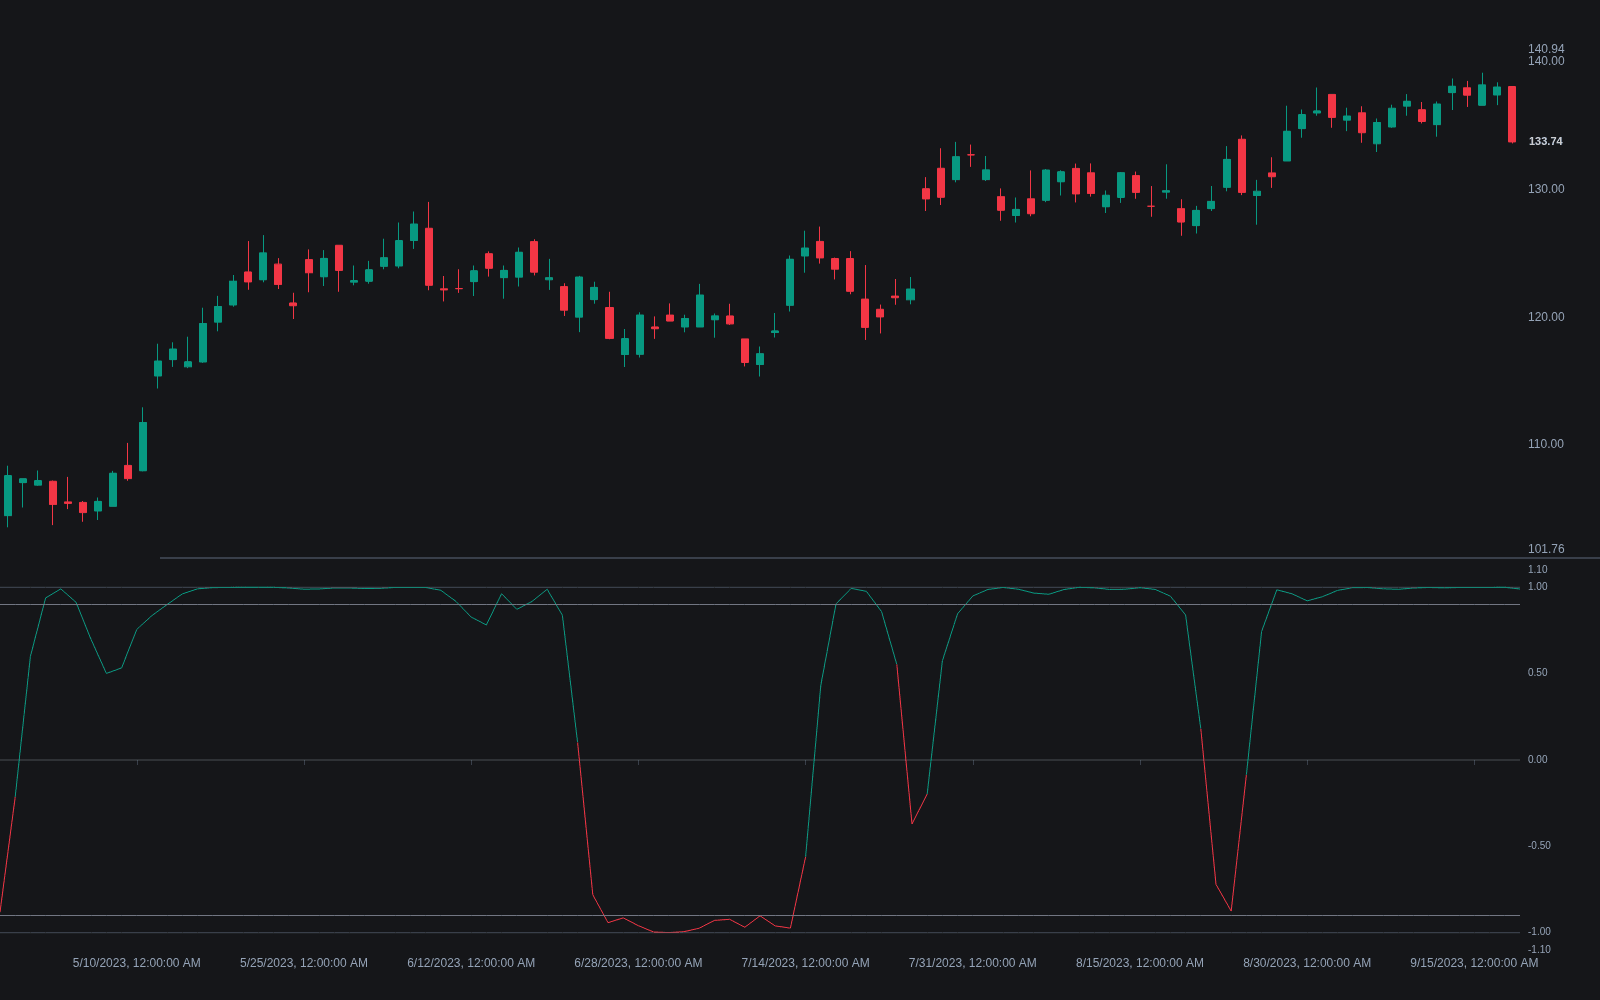
What is the Even-Better Sinewave?
The even-better sinewave is a John Ehlers indicator, published in Cycle Analytics for Traders (2013) as an improvement on his earlier sinewave indicator. It filters price to a chosen wavelength band, smooths the result, and then normalizes it by its own recent power so the output is confined between roughly -1 and +1. The name reflects the design goal: a cleaner, more usable wave than the original sinewave construction.
Its distinguishing behavior is how it treats trends. Most cycle oscillators become unreliable when the market stops cycling; the even-better sinewave instead saturates, pinning near +1 in sustained uptrends and near -1 in sustained downtrends, while oscillating through the range when the market is actually swinging. That makes it unusual among Ehlers tools: it is often read as a trend indicator built from cycle machinery rather than a pure cycle timer.
The construction chain is characteristic Ehlers DSP: a high-pass filter removes components slower than the selected duration, a smoother such as the Ehlers SuperSmoother removes the fast noise, and the normalization step divides the smoothed wave by the square root of its average power. Because the normalization is local, the indicator adapts its amplitude automatically, without the fixed overbought and oversold levels that conventional oscillators need.
How it's calculated
The standard form published by Ehlers, with the wave and power computed over the three most recent filtered values:
Implementations differ in the order and exact coefficients of the high-pass and smoothing stages; the wave-over-root-power normalization is the defining step.
How traders use it
- Trend-mode reading: values pinned near +1 or -1 for many consecutive bars are taken as confirmation of an established trend, and traders stay with trend-following tactics until the reading leaves the extreme.
- Swing timing: when the line oscillates through its range instead of saturating, crossings away from the extremes are used as swing entries, in the same spirit as the original sinewave indicator.
- Regime filter: some traders use it purely as a switch, enabling trend systems while it is saturated and mean-reversion systems while it cycles, similar in intent to other trend-versus-range classifiers.
- The duration input matters: it sets which wavelengths count as signal. Choosing it badly filters out the very swings being traded, and estimates from dominant cycle measurement can help but carry their own error.
- Like all normalized oscillators it says nothing about the size of a move, and rapid regime flips can produce a saturated reading just before a reversal.
Even-better sinewave vs related concepts
Sinewave Indicator: The original sinewave derives phase from a measured dominant cycle and plots sine and lead-sine lines; the even-better sinewave skips explicit phase measurement, normalizing a band-filtered wave instead, and tends to behave better when the market trends.
Reflex / Trendflex: Later Ehlers oscillators that also normalize by recent variability; Reflex is tuned to cycle content and Trendflex to trend content, while the even-better sinewave covers both modes in one bounded output.
Fisher Transform: The Fisher transform reshapes a normalized price position into a near-Gaussian variable to sharpen turning points; the even-better sinewave normalizes by signal power and is read as much for its saturation as for its turns.
Concept family
Statistics
46 concepts mapped · 46 in the Library
Even-better Sinewave FAQ
Turn Even-better Sinewave into a trading strategy.
Take the implementation from this page into Quant, then build on it, backtest it on real data, and keep refining it in conversation.