Concept
Quantile Regression
Quantile Regression, also known as robust/Theil-Sen, is a Statistics concept. The Library holds 2 implementations, each one a working definition you can pull into Quant.
Top Quantile Regression indicators
The top custom implementations, built on the original standard Quantile Regression formula.
2 total
From studying Quantile Regression to trading it: take any implementation below into Quant and backtest it instantly.
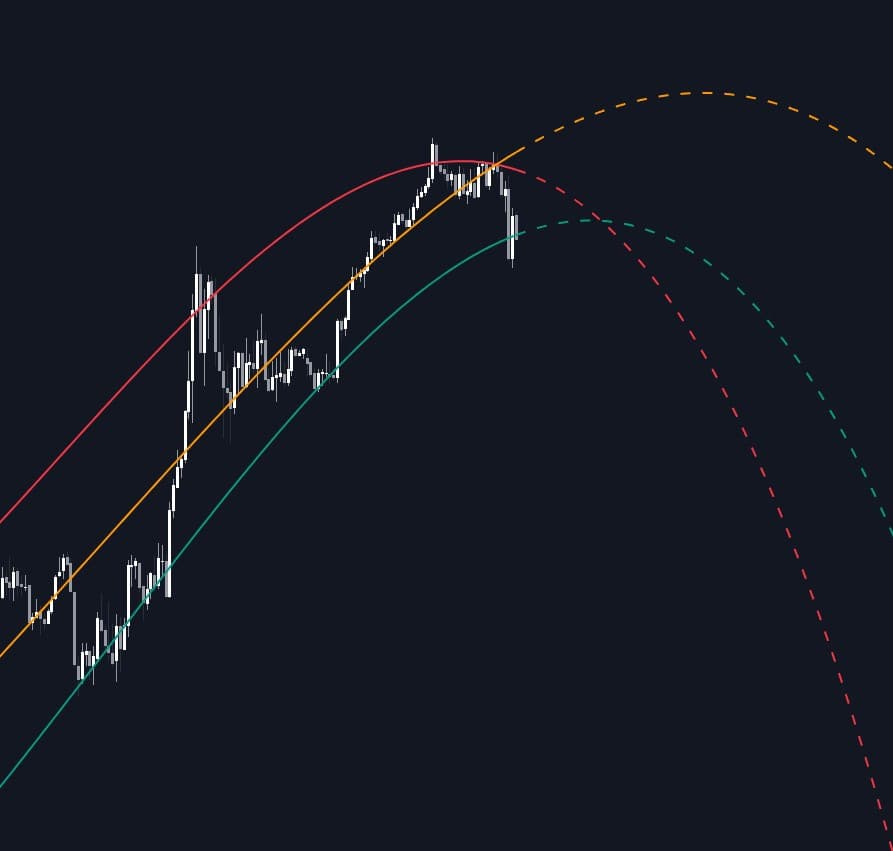
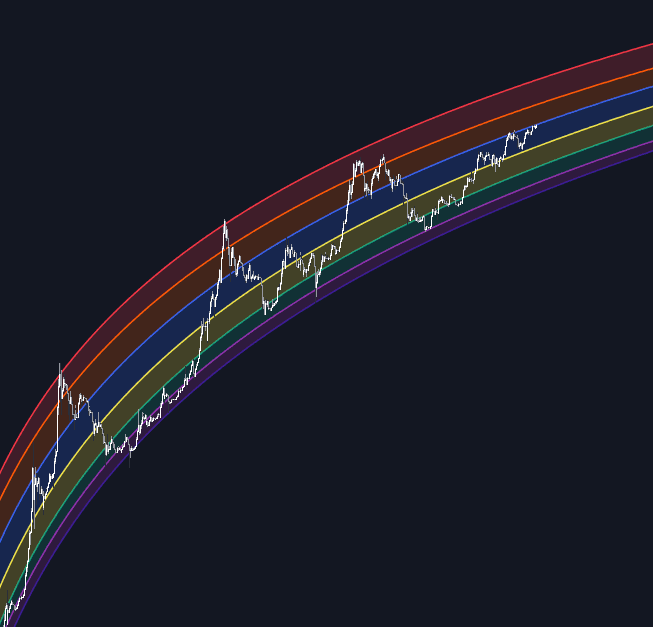
What is Quantile Regression?
Quantile regression fits a line to a chosen quantile of the data instead of its mean. Ordinary linear regression minimizes squared errors and delivers the conditional mean; quantile regression minimizes a tilted absolute-error loss (the pinball or check loss) in which, for a target quantile q, points above the fit are weighted by q and points below by 1 minus q. Setting q to 0.5 yields median regression, the least-absolute-deviations fit; q of 0.05 and 0.95 yield outer lines with roughly 5% of the data beyond each, in-sample.
The method was formalized by Roger Koenker and Gilbert Bassett in a 1978 Econometrica paper, though the median-regression idea is far older, tracing to Boscovich's eighteenth-century geodesy and Laplace's refinements of it. The robust-slope relatives grouped with it have their own lineage: the Theil-Sen estimator, the median of slopes over all pairs of points, dates to Henri Theil in 1950 and Pranab Sen in 1968.
On charts it shows up mainly as robust fits and channels. A median-slope fit resists the outlier bars that drag least-squares lines around, and outer quantile fits form a channel calibrated to how often price actually closed outside it, rather than assuming normality the way sigma-multiple regression channels do. The Theil-Sen slope is a related robust choice wherever a trend estimate has to survive spikes, gaps, and bad prints.
For traders the draw is honesty about distribution shape. Returns are skewed and heavy-tailed, and tools built on standard deviations, from z-scores to sigma bands, quietly assume otherwise. Fitting several quantiles at once profiles the conditional distribution directly, complementing distribution-of-returns profiling done on raw returns, and curved variants, spline or polynomial bases fitted under pinball loss, extend the same idea to nonlinear trends. The cost is computational and interpretive: quantile fits need enough data per quantile to be stable, especially in the tails.
How to identify quantile regression tools on a chart
Quantile fits look like ordinary regression lines or channels; the giveaway is percentile-based, potentially asymmetric construction rather than mean-plus-sigma symmetry.
- 1Check the indicator's settings for a quantile or percentile parameter (0.5, or a pair like 0.05/0.95) instead of a standard-deviation multiplier; that marks a quantile fit.
- 2Compare the center line with a least-squares fit on the same window: after a large spike the quantile or Theil-Sen line holds its slope while least squares tilts toward the outlier.
- 3Count closes outside the outer lines: a 5th/95th channel should have left roughly one bar in twenty beyond each line, in-sample.
- 4Look for asymmetry: in skewed data the upper and lower lines sit at different distances from the median, something sigma channels never show.
- 5Watch stability at the window's edge; quantile fits on short lookbacks can jump when single bars enter or leave the sample.
How it's calculated
A fitted line that tracks a chosen quantile of price, such as the median or an upper quartile, rather than the average.
Introduced by Koenker and Bassett (1978); the fit has no closed form and is solved by linear programming.
Each tau targets a conditional quantile instead of the conditional mean, so the lines resist outliers better than ordinary least squares.
Theil-Sen is the related robust estimator: a single median-of-pairwise-slopes line, not a per-quantile fit.
How traders use it
- Robust trend measurement: median (q = 0.5) or Theil-Sen fits give slope estimates a single news spike cannot hijack, useful on gappy or thinly traded instruments.
- Quantile channels: outer fits such as the 5th and 95th percentiles frame stretch zones whose in-sample exceedance rate is set by construction; out-of-sample that rate can drift, so excursions are context, not automatic fades.
- Distribution-aware projection: fitting several quantiles at once sketches the whole conditional distribution of price or returns, which matters when the tails drive the decision more than the average does.
- Tail-risk framing: a fitted lower quantile of returns acts as an empirical, value-at-risk-style line, and its distance from the median tracks how the downside tail widens or tightens.
- As an input to scenario tools: empirical quantile bands give probability cones and Monte Carlo price paths a data-driven alternative to normal-distribution widths.
Quantile regression vs related statistical fits
Linear Regression: Least squares estimates the conditional mean, and a single outlier bar moves the whole line. Quantile regression targets the median or any other quantile, bending far less to extremes and describing the distribution's edges as well as its center.
Polynomial Regression: Polynomial regression changes the shape of the fit, curves instead of straight lines, while still targeting the mean. Quantile regression changes the target instead, and the two combine: curved bases fitted under pinball loss draw curved quantile channels.
Percentile Rank: Percentile rank scores where the latest value sits inside a rolling window's distribution, with no model of trend. Quantile regression fits trend and quantile jointly, describing where the distribution's edges run as a function of time rather than scoring one observation.
Concept family
Statistics
46 concepts mapped · 46 in the Library
Quantile Regression FAQ
Turn Quantile Regression into a trading strategy.
Take any implementation from this page into Quant, then build on it, backtest it on real data, and keep refining it in conversation.