Concept
Adaptive-parameter Technique
Adaptive-parameter Technique is a Statistics concept. The Library holds 1 implementation, a working definition you can pull into Quant.
Top Adaptive-parameter Technique indicator
The top custom implementation, built on the original standard Adaptive-parameter Technique formula.
1 total
This Adaptive-parameter Technique implementation is strategy-ready: open it in Quant, set your rules, and it backtests automatically.
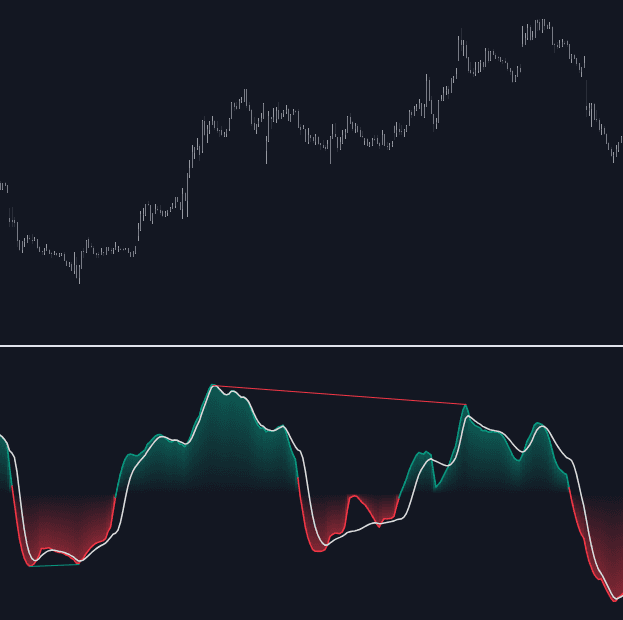
What is an Adaptive-parameter Technique?
An adaptive-parameter technique replaces a fixed indicator setting, such as a 14-bar lookback or a smoothing constant, with a value computed from the market itself. In the Ehlers DSP tradition the driver is the measured cycle: estimate the dominant period with dominant cycle measurement, then set the indicator's length to that period or a fixed fraction of it, so the tool stays tuned to the rhythm the market is actually running rather than the rhythm assumed at design time.
The tradition has clear roots. Perry Kaufman's adaptive moving average scaled smoothing speed by an efficiency ratio, Tushar Chande's VIDYA drove an EMA's smoothing constant from volatility, and John Ehlers imported digital signal processing wholesale, estimating the dominant period with the Hilbert transform or an autocorrelation periodogram and feeding the estimate into indicator lengths. Spectral methods such as FFT analysis can supply the same driver, though practitioners tend to favor estimators that behave on short, noisy samples.
Cycle period is not the only driver. Volatility-driven designs retune lengths or smoothing speed as ranges expand and contract, with the direction a design choice: some slow down to damp the extra noise, others speed up to track the bigger swings. Efficiency-ratio logic, the mechanism inside Kaufman's average, speeds smoothing up when price travels in straight lines. The honest trade-off is constant across all of them: fixed-parameter error is exchanged for measurement error, and when the underlying estimate is unstable, the adapted indicator inherits every jump.
Under the hood this is an estimation problem, and standard statistical hygiene applies. Raw drivers are usually normalized, often as a z-score or percentile rank, before they steer anything; hard bounds keep the derived parameter inside sane limits; and smoothing or hysteresis stops it from flapping bar to bar. When the question is trendiness rather than periodicity, regime statistics such as fractal dimension or entropy measures serve as alternative drivers.
How to evaluate an adaptive-parameter indicator on a chart
There is no pattern to spot; the chart work is checking that the adaptation behaves sensibly before any signal is trusted.
- 1Identify the driver from the documentation or inputs (cycle period, volatility, efficiency) and plot the driver itself where the platform allows it.
- 2Run the adaptive version beside its fixed-parameter equivalent through both a trending stretch and a congested one; the difference in behavior is the adaptation's entire contribution.
- 3Watch for parameter flapping: abrupt changes in the indicator's character that match nothing visible in price usually trace back to an unstable measurement.
- 4Check the bounds: an effective length pinned at its minimum or maximum is not adapting, it is saturated, and the tool degenerates into a fixed indicator.
How traders use it
- Cycle-tuned oscillators: momentum and stochastic lengths set from the measured dominant cycle (commonly a fixed fraction such as a half cycle) so overbought and oversold swings line up with the market's actual rhythm instead of a fixed calendar.
- Regime-responsive smoothing: moving averages whose smoothing constant tightens when volatility or efficiency rises and loosens in chop, reducing whipsaw without a manual settings change.
- Cutting re-optimization: one adaptation rule can replace per-symbol, per-timeframe tuning of fixed lengths. It still needs validation, because noisy measurements can make parameters flap and degrade the very stability adaptation promises.
- Adaptive forecasting: the same design appears in exponential smoothing forecasts whose constants update with observed error, a reminder that adaptive parameters long predate trading indicators.
- Discrete regime switching: instead of sliding a parameter continuously, some designs classify the regime first and jump between preset parameter sets, trading smoother behavior within regimes for edge effects at the switches.
Adaptive-parameter techniques vs related concepts
Dominant Cycle Measurement: The measurement layer rather than the application: it estimates the market's current period. An adaptive-parameter technique is one consumer of that estimate, turning it into a lookback or smoothing constant.
Fractal Dimension: A statistic describing how trend-like or congested price movement is. On its own it only describes; used as a driver, it becomes the input an adaptive technique acts on.
Exponential Smoothing Forecasts: The forecasting tradition where error-driven smoothing constants appeared decades ago. Trading's adaptive indicators apply the same principle to oscillators and averages rather than to demand or sales series.
Concept family
Statistics
46 concepts mapped · 46 in the Library
Adaptive-parameter Technique FAQ
Turn Adaptive-parameter Technique into a trading strategy.
Take the implementation from this page into Quant, then build on it, backtest it on real data, and keep refining it in conversation.