Streak Analysis
Streak Analysis, also known as Run analysis, Consecutive up/down days, Consecutive candles, are Statistics concepts. The Library holds 1 implementation, a working definition you can pull into Quant.
Top Streak Analysis indicator
The top custom implementation, built on the original standard Streak Analysis formula.
1 total
From studying Streak Analysis to trading it: take the implementation below into Quant and backtest it instantly.
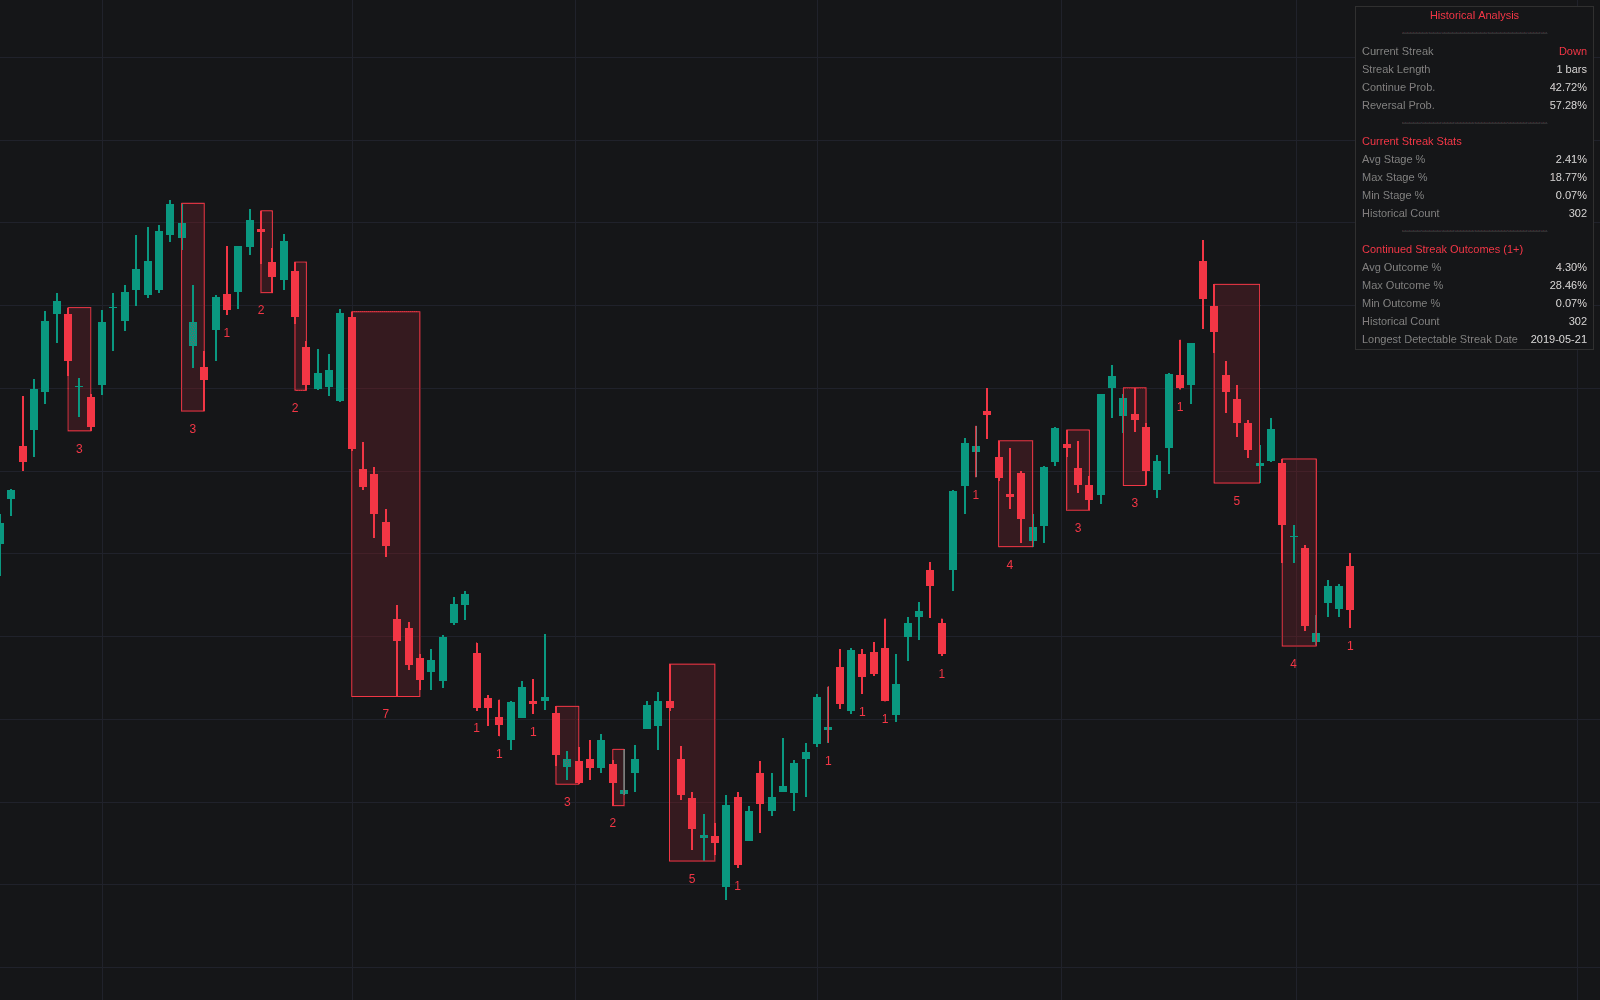
What is streak analysis?
Streak analysis counts consecutive bars or sessions that close in the same direction and compares the live streak with the historical distribution of streak lengths and what followed them. A bullish streak is a run of closes above the prior close, or of sessions closing above their open, depending on the definition. The analysis asks how often runs of the current length went on to extend, how far they traveled, and how unusual the current run is.
The natural benchmark is a coin. If bars were independent and each moved in the streak's direction with probability p, every run would continue with probability p however long it already was, and the share of runs reaching length k would be p^(k - 1): with p = 0.5, one run in sixteen reaches five bars. Continuation rates that hold up as streaks lengthen point to persistence, rates that fall away point to mean reversion, and the classic formal test of randomness in a sequence of ups and downs is the Wald-Wolfowitz runs test.
Definitions change the answer: close-to-close and open-to-close streaks are different series, unchanged closes must be handled (most implementations end the run), and a five-day streak carries different information from a five-minute one. Sample size binds hardest, since long streaks are rare by construction and the statistics at the longest lengths rest on few runs.
How it's calculated
A streak counter plus a continuation rate, with the independence benchmark for comparison:
Session-based versions compare each session's close with its own open instead of the prior close.
Report N(L ≥ k) next to q_k: at long lengths the rate may rest on a handful of runs.
How traders use it
- Overextension context: LuxAlgo's Consecutive Candle Streak Analysis stores every completed close-to-close run and reports, for the live streak, the share of comparable runs that continued or reversed, the average and maximum move at the same stage, and an alert when the run exceeds every one on record.
- Session rhythm: LuxAlgo's Session Streaks labels each session bullish (close at or above the open) or bearish and reports the count, median and mode of historical streak lengths, a base rate for how long runs usually last on that symbol.
- Mean-reversion inputs: short-term systems use streak length as a measure of stretch, most visibly the streak component of Connors RSI.
- Testing for structure: comparing continuation rates with the coin benchmark, or with shuffled returns (resampling tests), shows whether streak behavior differs from chance.
- With honest limits: base rates describe the past sample and shift with regime; a streak's length is context for risk, not a signal.
Streak analysis vs related statistics
Connors RSI: Feeds a signed streak count through a 2-period RSI as one of three components. Streak analysis studies the run lengths themselves and their historical outcomes.
Distribution-of-returns Profiling: Profiles the size of moves; streak analysis studies their sequence. Two markets with identical return distributions can show very different streak behavior.
Autocorrelation: Measures linear dependence between returns at a given lag. Streak analysis is a sign-only, run-length view of dependence: cruder, but directly readable as how often runs continue.
Concept family
Statistics
45 concepts mapped · 45 in the Library
Streak Analysis FAQ
Turn Streak Analysis into a trading strategy.
Take the implementation from this page into Quant, then build on it, backtest it on real data, and keep refining it in conversation.